Fig. 1
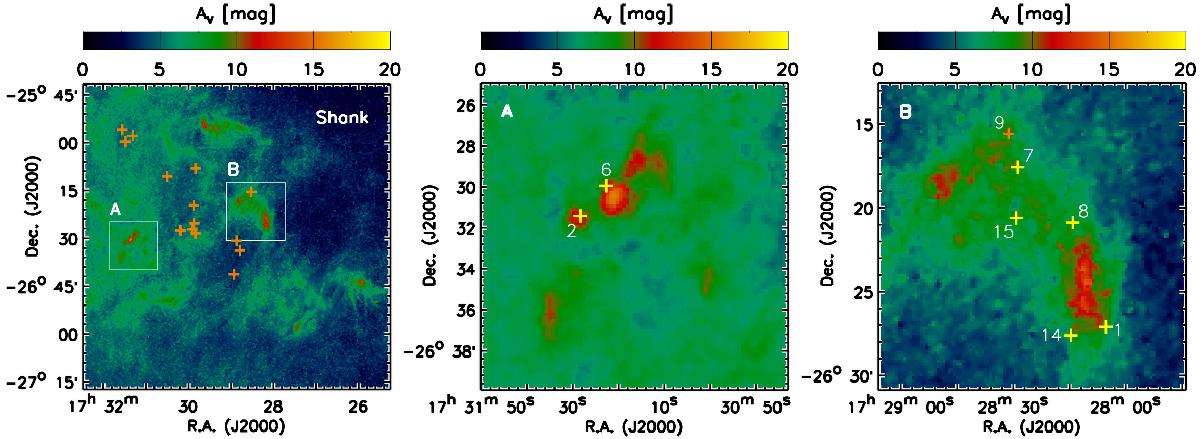
Extinction map of the Shank in the Pipe Nebula based on the near-infrared color excess (Román-Zúñiga et al. 2010). Overlaid are the positions of the targets. The sources where water ice is positively detected are marked by yellow crosses, while those with negative detections are marked by orange crosses. The zoom-in view of the positive detections at the regions A and B are shown in the middle and right panel, respectively.
Current usage metrics show cumulative count of Article Views (full-text article views including HTML views, PDF and ePub downloads, according to the available data) and Abstracts Views on Vision4Press platform.
Data correspond to usage on the plateform after 2015. The current usage metrics is available 48-96 hours after online publication and is updated daily on week days.
Initial download of the metrics may take a while.