Fig. 8
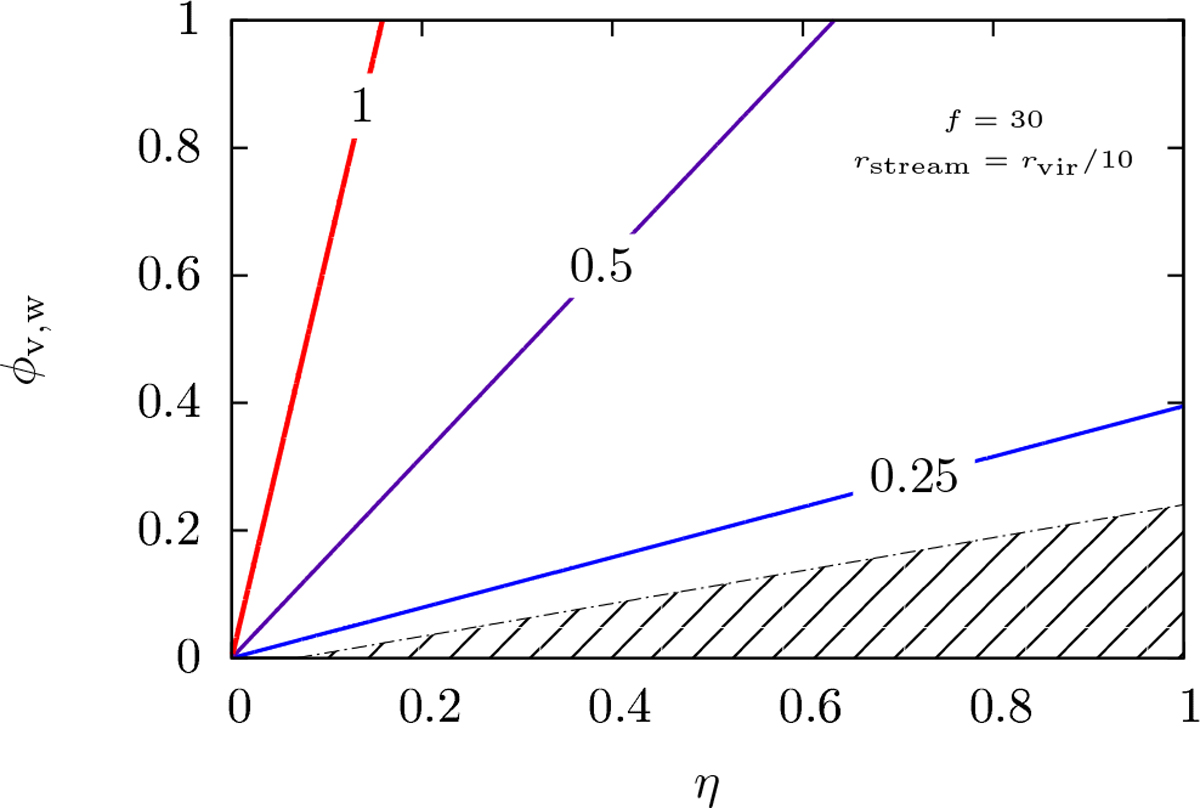
Disruption of the flow as a function of the volume-filling factor of the warm gas and level of turbulence. The contours represent constant ratios of tdisrupt /tdyn,halo as labeled (cf. Eqs. (5) and (15)). We assume f = 30 and rstream = rvir/10. In regions with values less than 1, the streams are disrupted. The shaded region has the same meaning as in Fig. 7.
Current usage metrics show cumulative count of Article Views (full-text article views including HTML views, PDF and ePub downloads, according to the available data) and Abstracts Views on Vision4Press platform.
Data correspond to usage on the plateform after 2015. The current usage metrics is available 48-96 hours after online publication and is updated daily on week days.
Initial download of the metrics may take a while.