Fig. 6
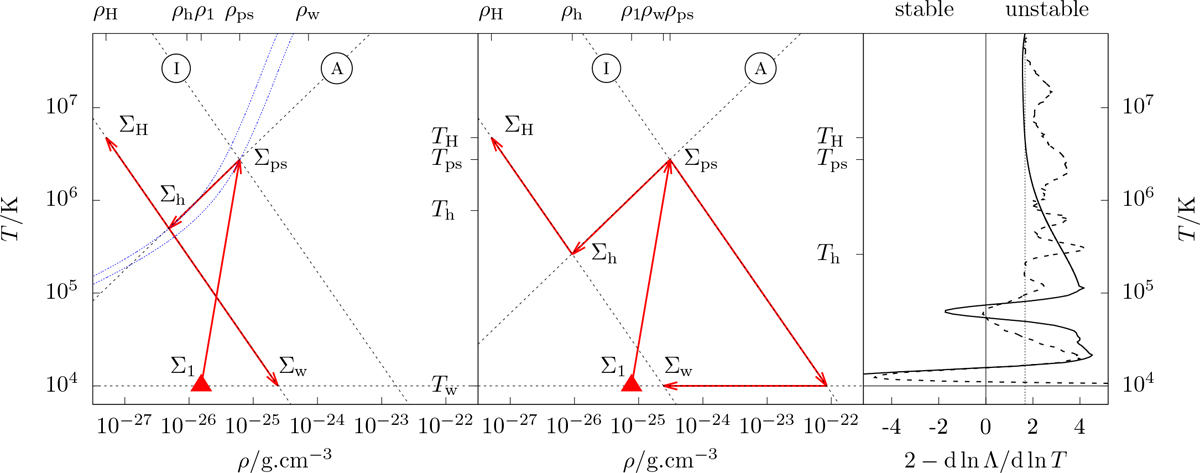
Left and middle: sketch of the thermodynamic path for cases (1) and (2) (see text). Σ1 (red triangle) indicates the density and temperature of the pre-shock gas. The gas is shocked reaching the point Σps. Subsequently, the gas cools adiabatically due to the expansion of the stream until the halo pressure is reached at Σh. Two phases separate. For case (1), phase separation occurs at Σh, while for case (2), it occurs at Σps. In both cases, the hot component mixes with the surrounding halo gas, reaching ΣH. For case (1), the warm component cools radiatively and isobarically to the point Σw. For case (2), the same point is reached but the gas takes a different thermodynamic path. Dashed black lines represent adiabats and isobars labeled A and I, respectively. The two blue-dashed curves in the left panel indicate contours of constant cooling time, tcool ~ 0.2tdyn,halo (upper curve) and tcool ~ 0.12tdyn,halo (lower curve). These curves indicate that the cooling time during the expansion remains approximately constant. (right) Analysis of the isobaric differential cooling “instability” (Eq. (8)) of low-, 10−3 solar (solid line) and solar-metallicity (dashed line) gas as a function of temperature. When 2 − d lnΛ∕ dlnT > 0 the gas can become heterogeneous through differential cooling if δ is sufficiently large. The post-shock temperature of our illustration lies within the region where the stream can become unstable.
Current usage metrics show cumulative count of Article Views (full-text article views including HTML views, PDF and ePub downloads, according to the available data) and Abstracts Views on Vision4Press platform.
Data correspond to usage on the plateform after 2015. The current usage metrics is available 48-96 hours after online publication and is updated daily on week days.
Initial download of the metrics may take a while.