Fig. 4
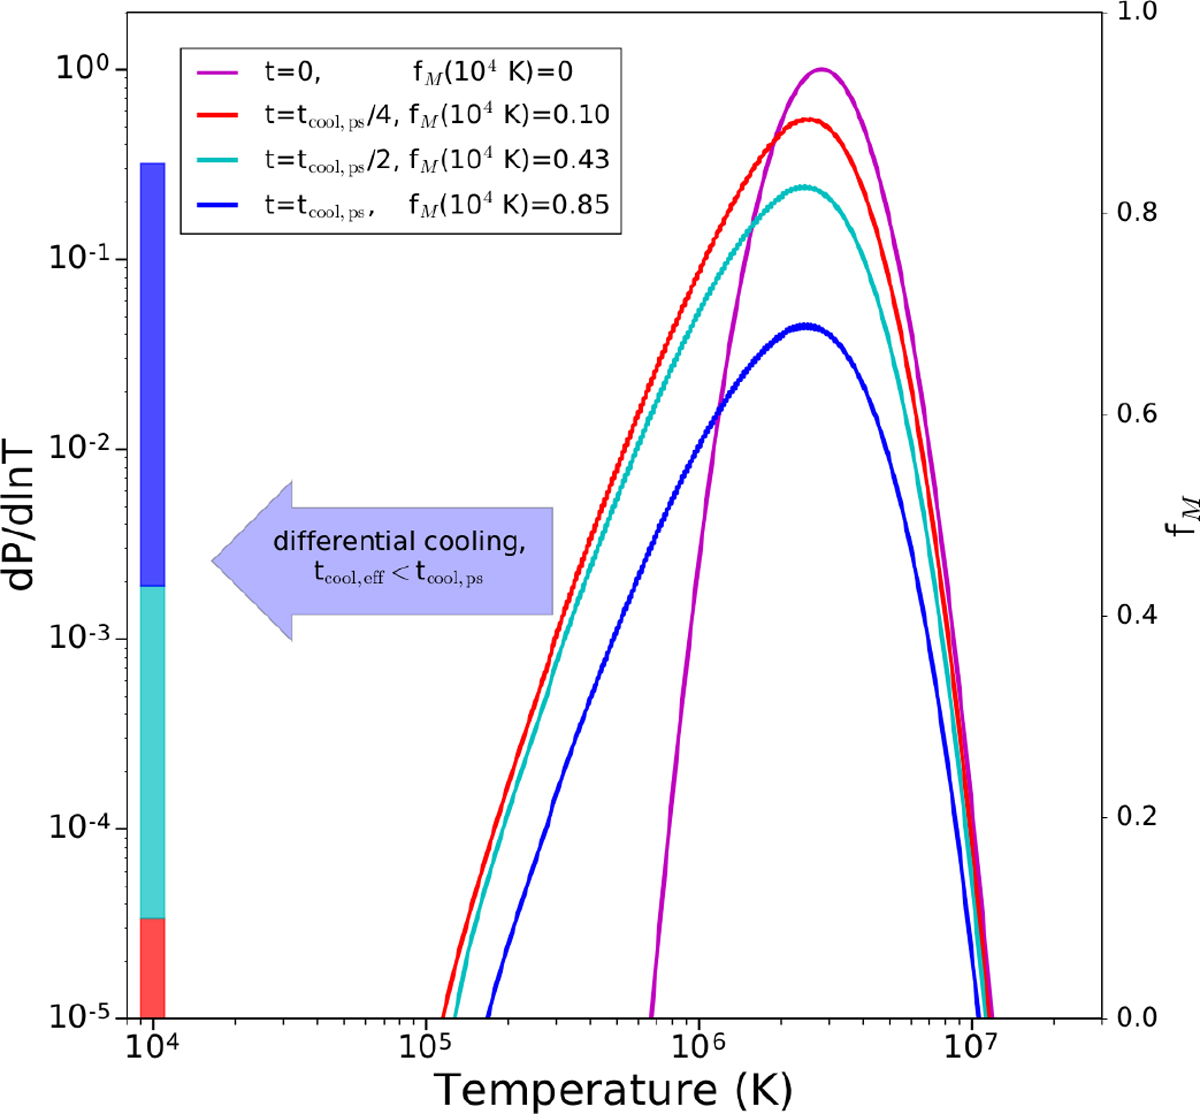
Temperature probability distribution function, dP/dln T, as a function of the gas temperature at various times during isobaric cooling. The initial distribution (magenta line) is lognormal with a dispersion, σT = 0.3, initial mean gas temperature, Tps = 2.7 × 10⁶ K, and initial pressure, Pps/kB = 5.8 × 10⁴ K cm−3. We show the distributions of gas temperature at 4 different times relative to tcool,ps as indicated in the legend. In the last column of the legend, we provide the fraction of the gas that has cooled to 104 K, fM, at each fraction of the post-shock cooling time. For example, in this illustration, after one post-shock cooling time, even though the peak gas temperature of the PDF has changed very little, ≈85% of the gas has cooled to 104 K. We represent these fractions in the colored bar in which each color corresponds to the PDF of the same color (the fractions, fM are relative to the ordinate on the right side of the panel). Once the gas starts to cool differentially, it does so very rapidly, in less than tcool,ps (large blue arrow).
Current usage metrics show cumulative count of Article Views (full-text article views including HTML views, PDF and ePub downloads, according to the available data) and Abstracts Views on Vision4Press platform.
Data correspond to usage on the plateform after 2015. The current usage metrics is available 48-96 hours after online publication and is updated daily on week days.
Initial download of the metrics may take a while.