Fig. 3
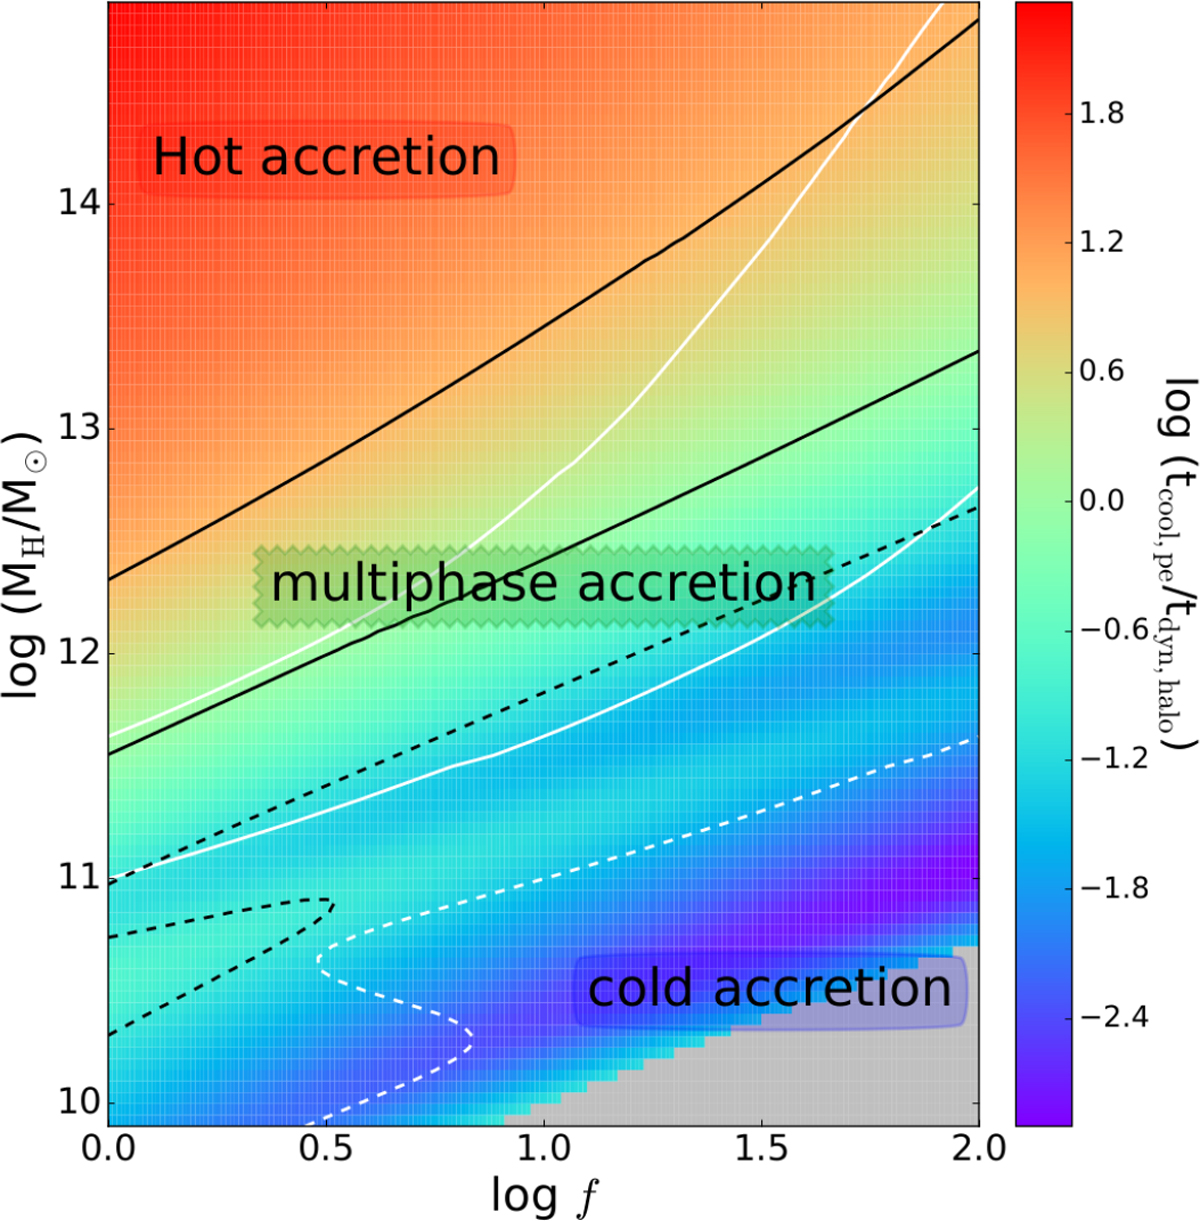
Ratio of the post-expansion cooling and halo dynamical timescales as a function of halo mass, MH, and stream overdensity, f, at z = 2. The colors represent log (tcool,pe∕tdyn,halo) (Eqs. (4) and (5)) with corresponding values indicated in the color bar. Black contours indicate log (tcool,pe∕tdyn,halo) = 0 and 1 (solid) and log (tcool,pe∕tdyn,halo) = −1 (dashed). The white contours indicate values of log (tcool,ps∕texpand) (Eqs. (3) and (4)) equal to 0 and 1 (solid), and −1 (dashed). For this analysis, we assumed log (rstream/rvir) = −1.5. We highlight regions in which the cooling times are significantly longer than the halo dynamical times as hot accretion, regions in which the cooling time is significantly shorter than the dynamical times as cold accretion, and regions in which the cooling times are of the same order of magnitude as the dynamical times as multiphase accretion (see text for details). These labels are illustrative and are not intended to precisely delineate a separation of accretion modes. The gray region in the bottom right corner has Tpe < 104 K, which is outside of the range of the cooling efficiency used in our analysis (Gnat & Sternberg 2007), and thus the values of log (tcool,pe∕tdyn,halo) are not defined.
Current usage metrics show cumulative count of Article Views (full-text article views including HTML views, PDF and ePub downloads, according to the available data) and Abstracts Views on Vision4Press platform.
Data correspond to usage on the plateform after 2015. The current usage metrics is available 48-96 hours after online publication and is updated daily on week days.
Initial download of the metrics may take a while.