Fig. 2
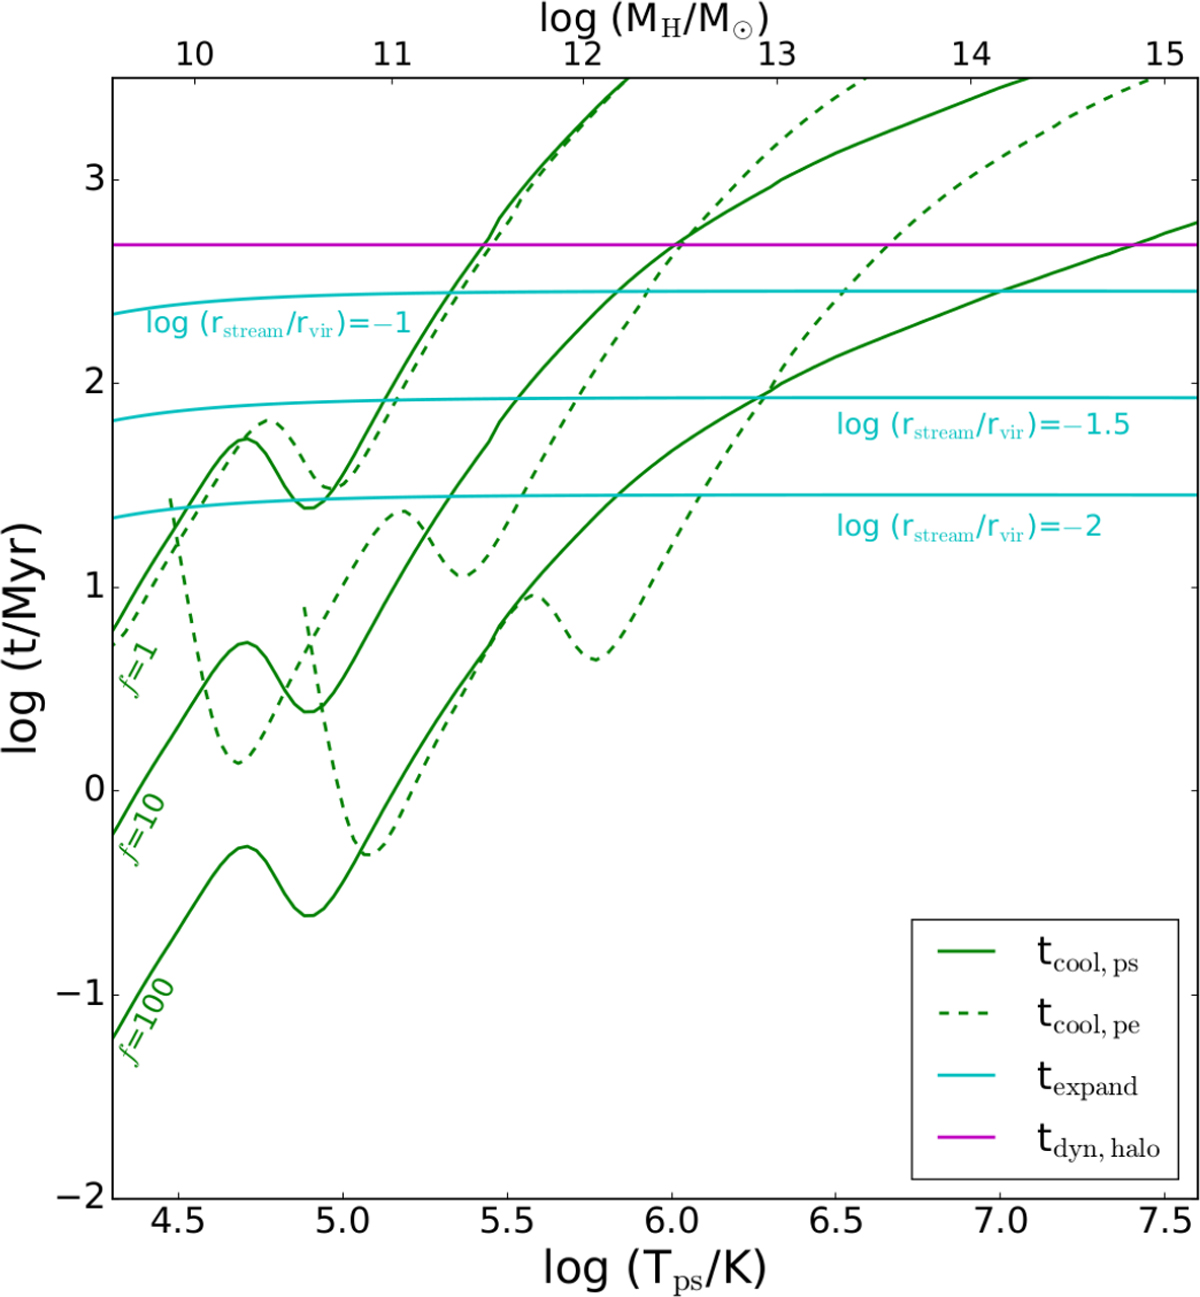
Timescale comparison of the competing relevant processes of cooling, expansion, and halo dynamics, for various post-shock temperatures (i.e., various halo masses), at z = 2. The solid green curves indicate the instantaneous post-shock cooling time, tcool,ps, and the green dashed curves indicate the post-expansion cooling time, tcool,pe – the cooling time of the post-shock gas after it has expanded sufficiently to reach pressure equilibrium with the ambient halo gas. The cooling time curves for the post-expansion gas are truncated at the minimum temperature, 104 K, of the cooling efficiency used in our analysis (Gnat & Sternberg 2007). The cooling time curves were computed for three values of the initial overdensity f, as indicated by inclined green labels on the left side of the panel. Expansion times (solid cyan lines) are shown for three different relative filament radii, log rstream /rvir = −1, −1.5, and −2. The dynamical time, tdyn,halo, which is independent of halo mass, is indicated by the horizontal magenta line.
Current usage metrics show cumulative count of Article Views (full-text article views including HTML views, PDF and ePub downloads, according to the available data) and Abstracts Views on Vision4Press platform.
Data correspond to usage on the plateform after 2015. The current usage metrics is available 48-96 hours after online publication and is updated daily on week days.
Initial download of the metrics may take a while.