Fig. C.1
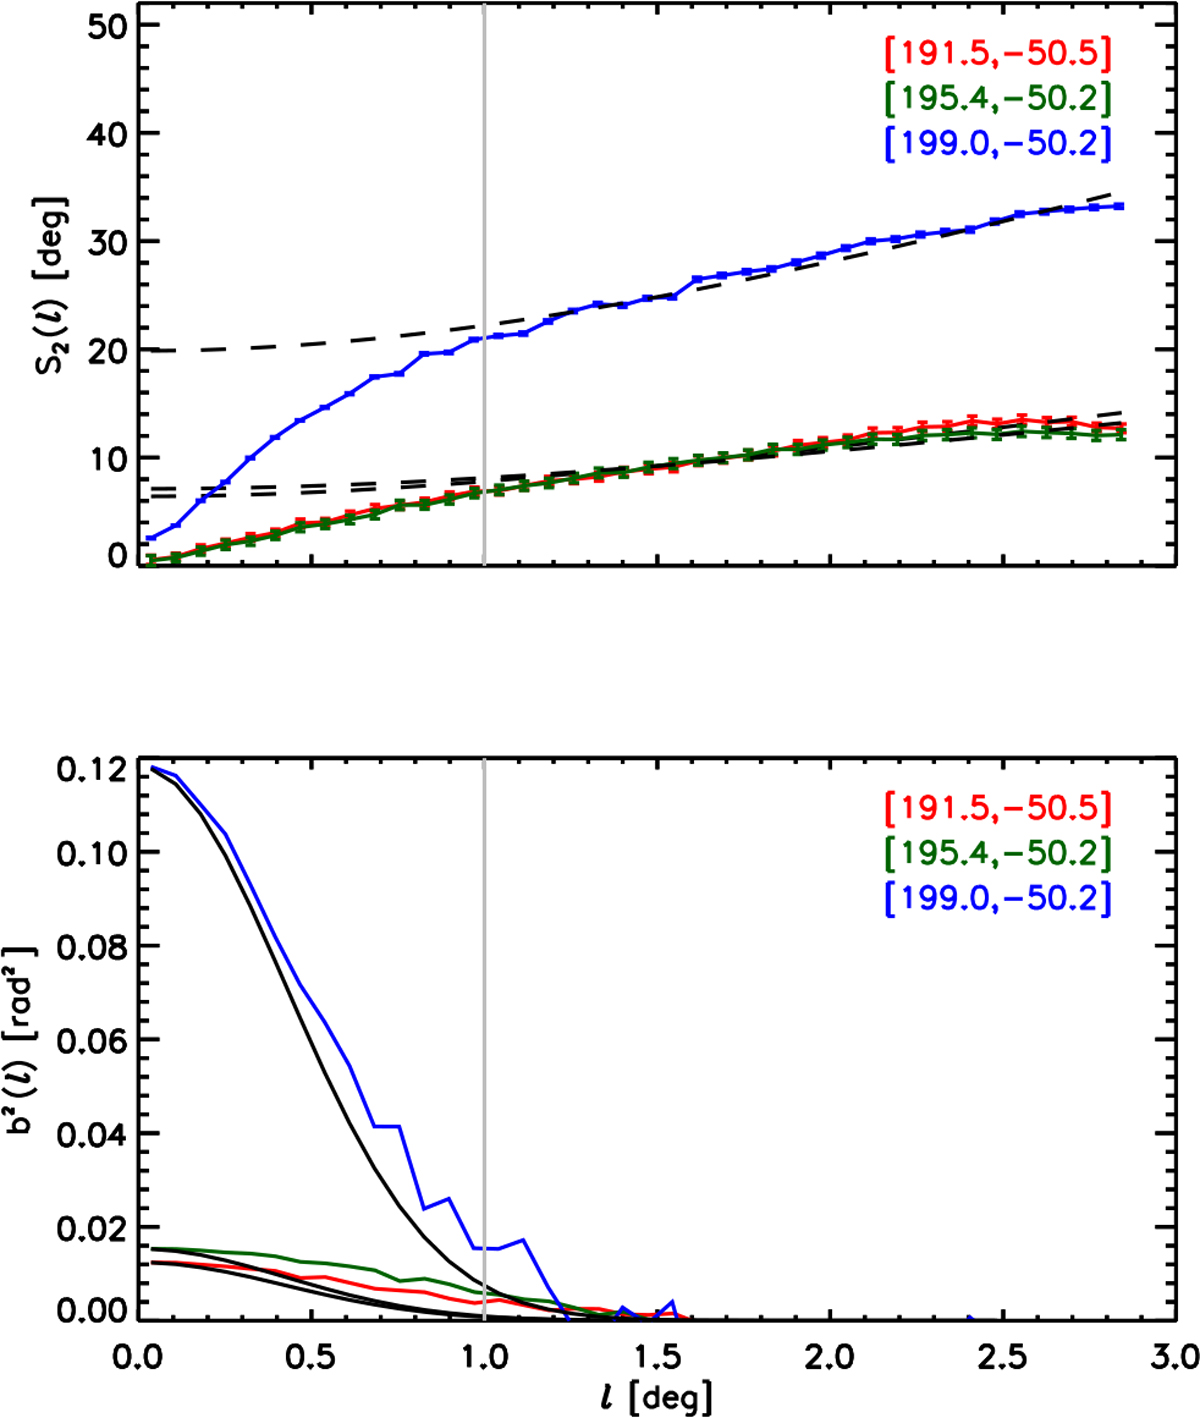
Structure function of the polarization angles, S2(ℓ), and normalized autocorrelation function of the plane-of-the-sky component of the magnetic field, b2 (ℓ) (Houde et al. 2009), in the vicinities of 3 deg in diameter centered on the 21-cm emission-line Zeeman splitting observations presented in Heiles (1989). In the top panel, the dashed lines correspond to the fit to the values of S2 (ℓ) in the range ℓ > 1 deg, which is theeffective resolution of the Planck observations, represented by the vertical solid line. In the bottom panel, the solid black lines correspond to the expected correlation produced by the effective resolution of the observations.
Current usage metrics show cumulative count of Article Views (full-text article views including HTML views, PDF and ePub downloads, according to the available data) and Abstracts Views on Vision4Press platform.
Data correspond to usage on the plateform after 2015. The current usage metrics is available 48-96 hours after online publication and is updated daily on week days.
Initial download of the metrics may take a while.