Fig. 1
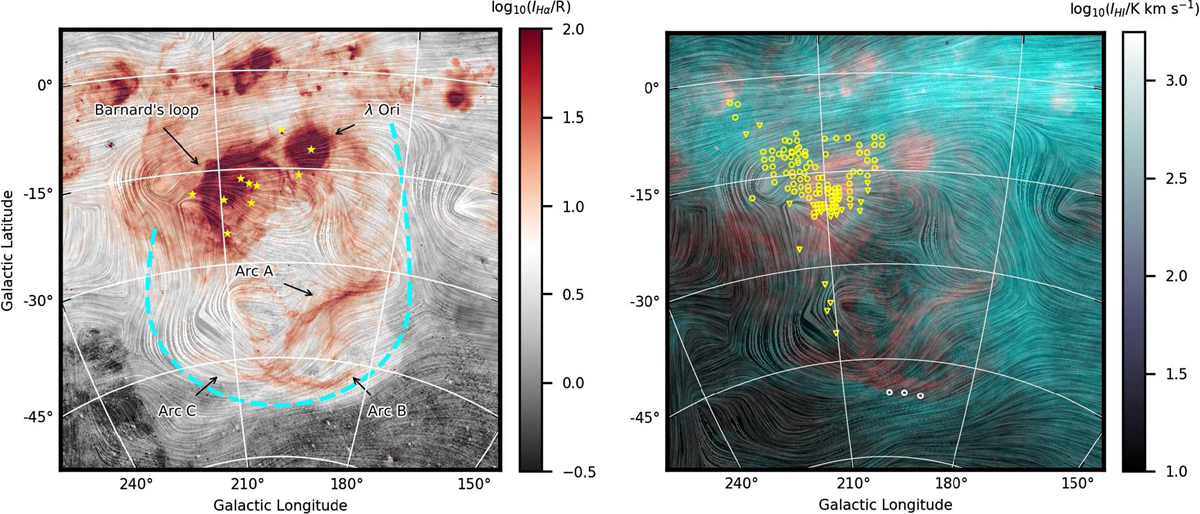
Stereographic projections of observations toward the Orion-Eridanus superbubble. The drapery pattern, produced using the line integral convolution technique (LIC; Cabral & Leedom 1993), corresponds to plane-of-the-sky magnetic field orientation inferred from the Planck 353-GHz polarization observations. Left: total integrated Hα emission map. The dashed line indicates the approximate location of the edge of the superbubble. The yellow symbols correspond to the main stars in the Orion constellation. Right: total integrated Hα emission (Gaustad et al. 2001) and HI 21-cm emission (HI4PI Collaboration et al. 2016) integrated between − 20 and 20 km s−1 shown in red and teal colors, respectively. The yellow symbols correspond to the line-of-sight magnetic field directions derived fromthe HI emission-line Zeeman splitting observations (Heiles 1989, 1997). The circles and triangles correspond to magnetic fields pointing toward and away from the observer, respectively. The three white circles in the bottom are the regions analyzed in this Letter.
Current usage metrics show cumulative count of Article Views (full-text article views including HTML views, PDF and ePub downloads, according to the available data) and Abstracts Views on Vision4Press platform.
Data correspond to usage on the plateform after 2015. The current usage metrics is available 48-96 hours after online publication and is updated daily on week days.
Initial download of the metrics may take a while.