Fig. 7
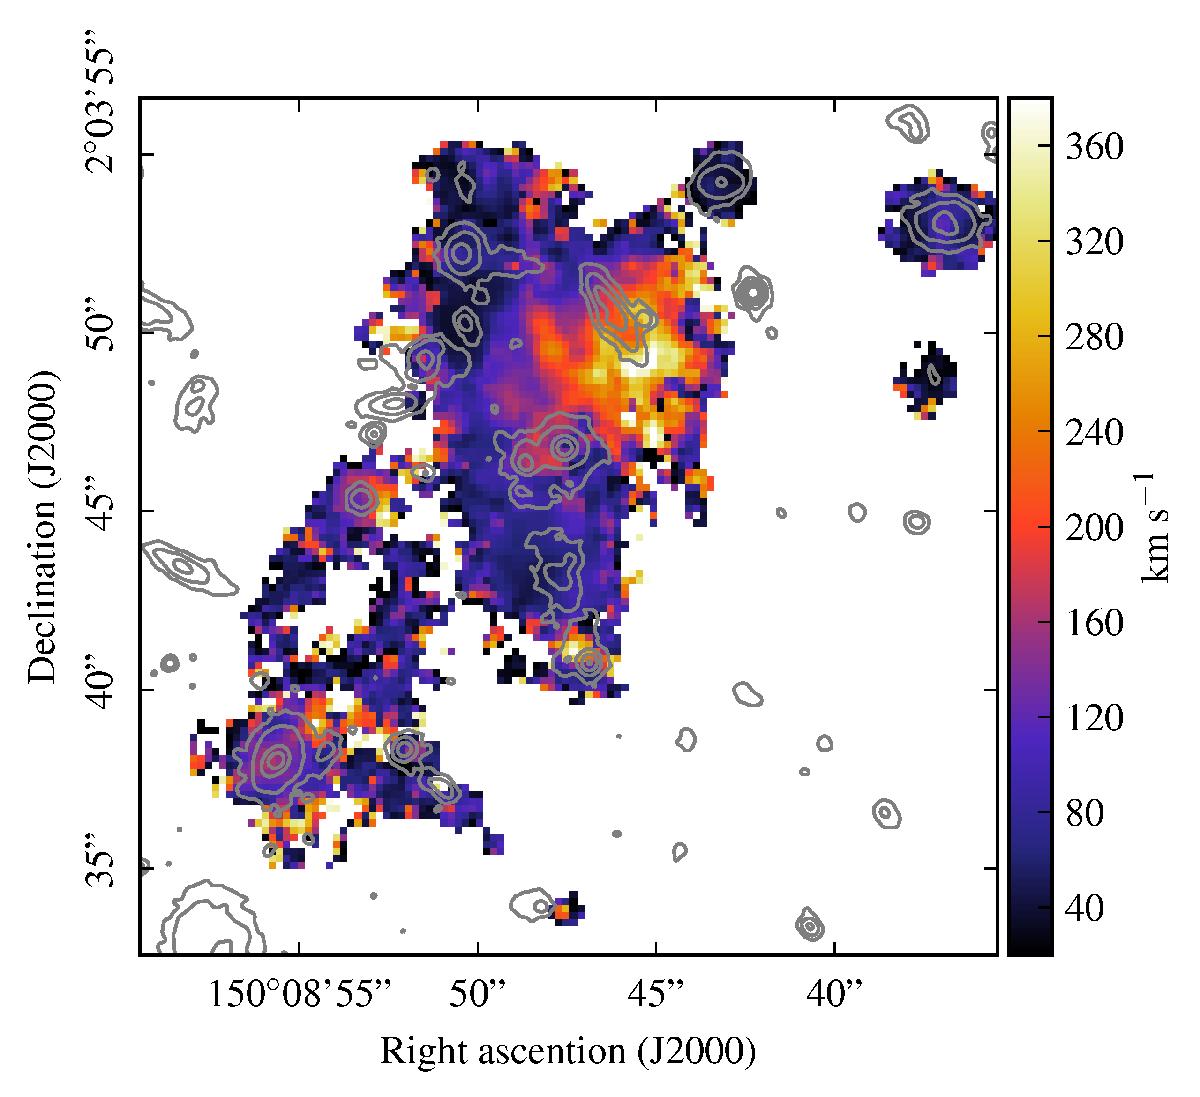
Velocity dispersion map corrected for the instrumental LSF with HST contours overlaid in grey. Contours are logarithmic and smoothed using a 0.09′′ FWHM Gaussian. A threshold of 1.5 × 10⁻¹⁸ erg s-1 cm-2 arcsec-2 has been applied on the [O ii] surface brightness map smoothed using a 0.28′′ FWHM Gaussian, to mask regions with a too low signal-to-noise ratio.
Current usage metrics show cumulative count of Article Views (full-text article views including HTML views, PDF and ePub downloads, according to the available data) and Abstracts Views on Vision4Press platform.
Data correspond to usage on the plateform after 2015. The current usage metrics is available 48-96 hours after online publication and is updated daily on week days.
Initial download of the metrics may take a while.