Fig. 6
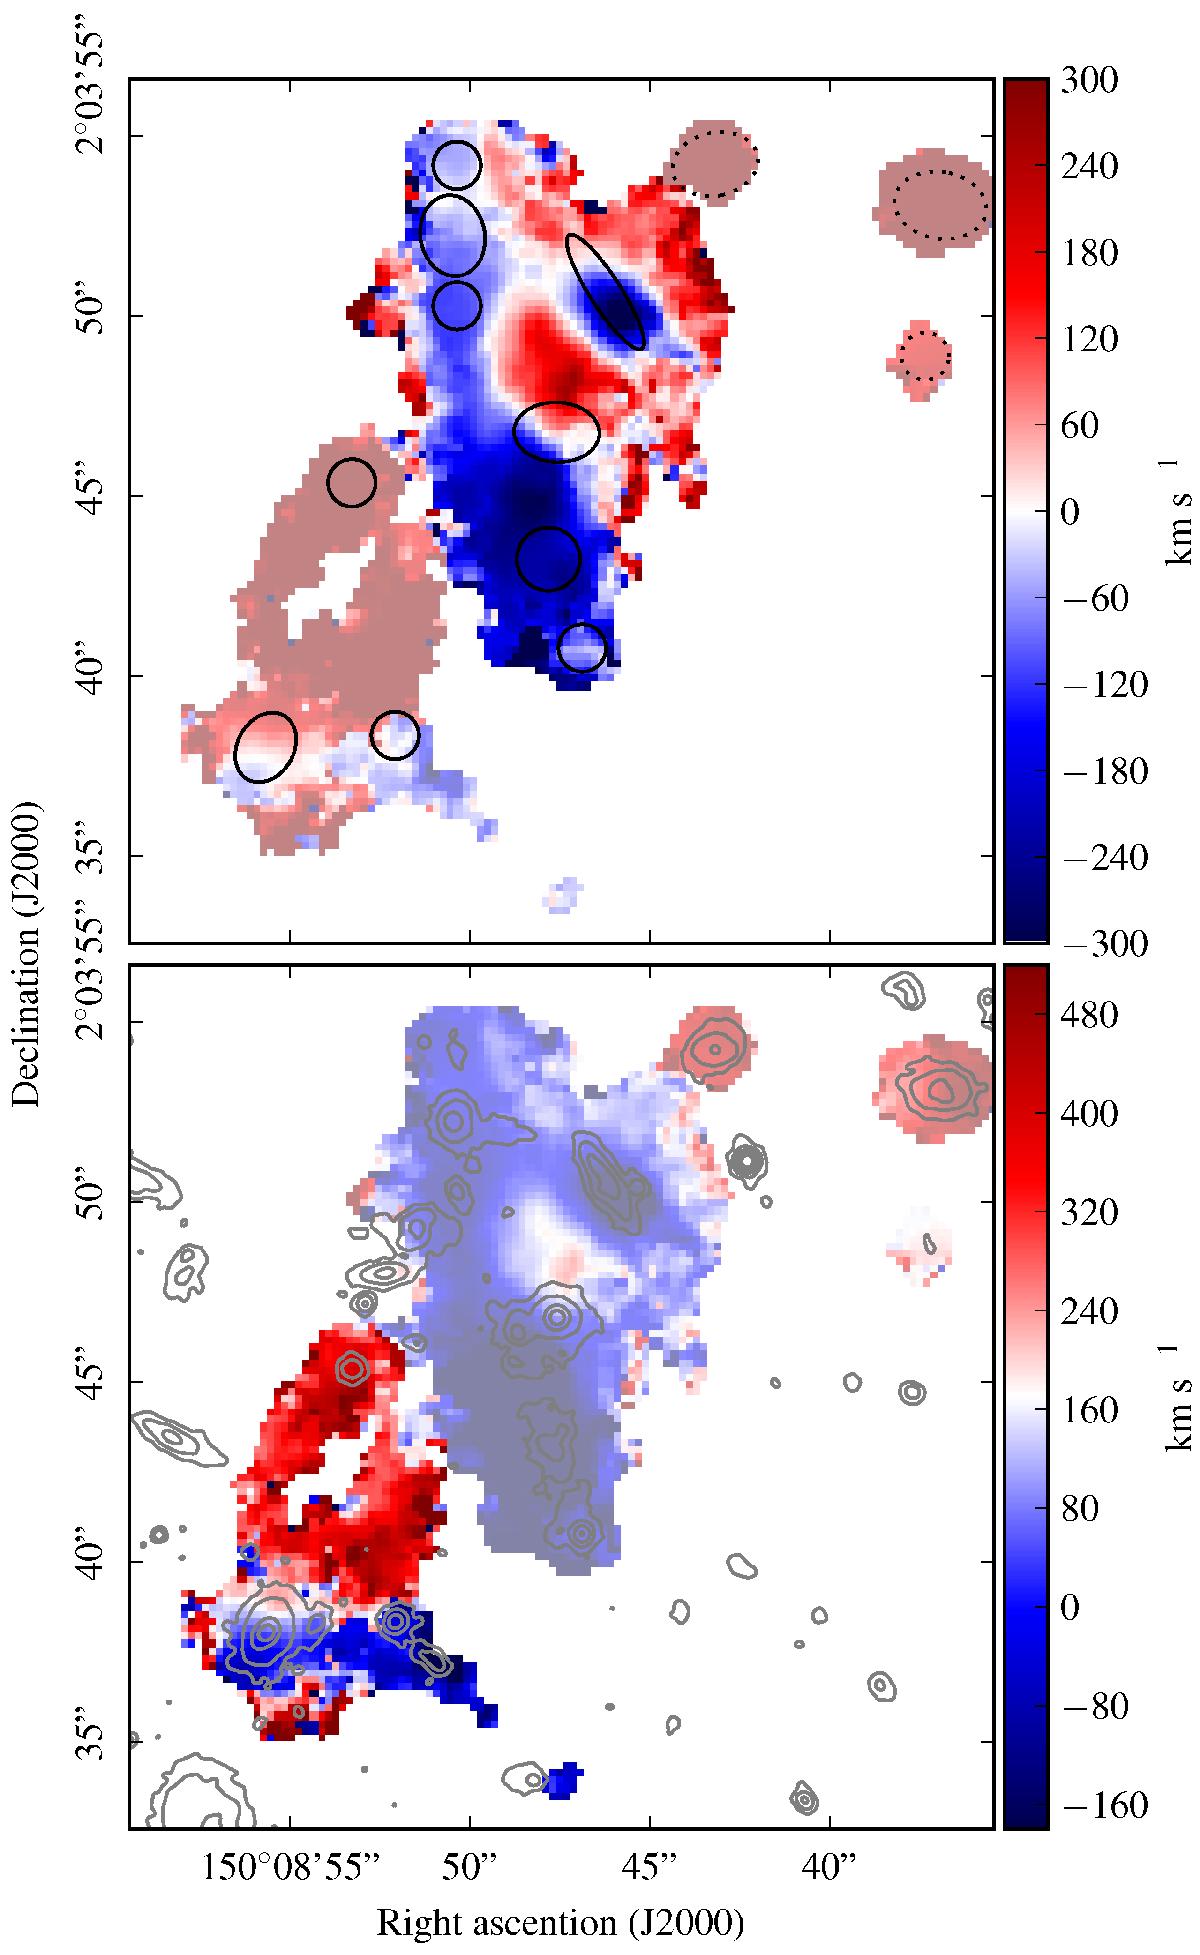
[O ii] velocity fields over a 25′′ square field of view using two different velocity ranges centred on the northern (top) and southern (bottom) components highlighted in each panel. A threshold of 1.5 × 10⁻¹⁸ erg s-1 cm-2 arcsec-2 has been applied on the [O ii] surface brightness map smoothed using a 0.28′′ FWHM Gaussian, to mask regions with a too low signal-to-noise ratio. Regions outside each component are faded to distinguish them better. In the top panel, group members are overlaid using black ellipses. Three galaxies do not seem directly linked to any extended gas region and are indicated with dotted ellipses. In the bottom panel, HST contours are overlaid in grey. They are logarithmic and smoothed using a 0.09′′ FWHM Gaussian.
Current usage metrics show cumulative count of Article Views (full-text article views including HTML views, PDF and ePub downloads, according to the available data) and Abstracts Views on Vision4Press platform.
Data correspond to usage on the plateform after 2015. The current usage metrics is available 48-96 hours after online publication and is updated daily on week days.
Initial download of the metrics may take a while.