Fig. 5
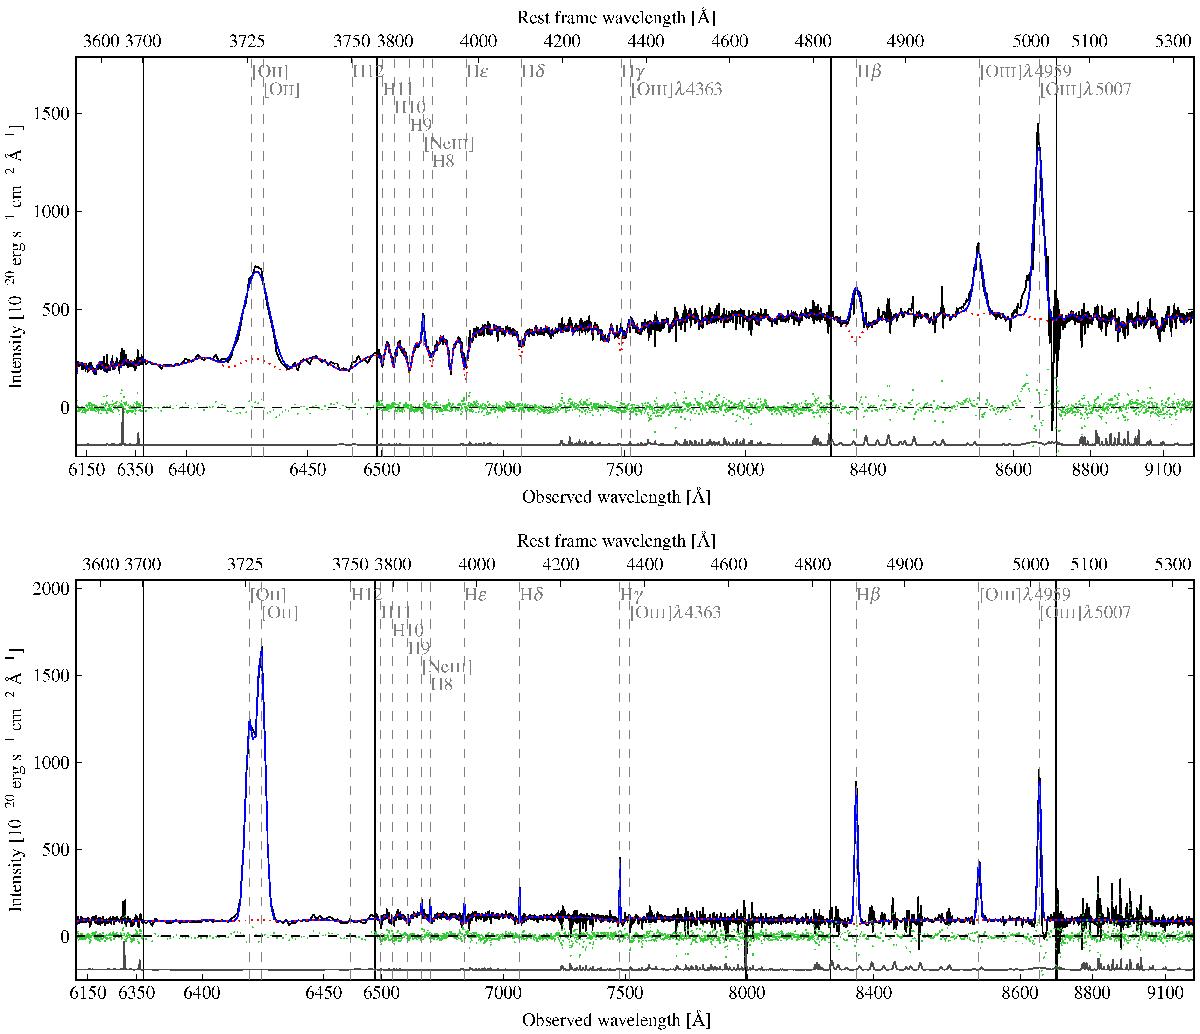
Examples of spectra for CGr30-71 (top) and CGr30-59 (bottom). In each panel, the MUSE integrated spectrum (black) is plotted with pPXF continumm (dotted red) plus Camel emission lines model (blue), model residuals (green dots), and the variance spectrum (grey), which is shifted below zero for clarity. The name and position of the main emission lines are indicated in grey. Black vertical lines separate spectral ranges displayed with different scales to zoom in on the main emission lines. In the top panel, the broadening of emission lines due to the AGN is clearly visible. In the bottom panel, the [O ii] doublet is well resolved.
Current usage metrics show cumulative count of Article Views (full-text article views including HTML views, PDF and ePub downloads, according to the available data) and Abstracts Views on Vision4Press platform.
Data correspond to usage on the plateform after 2015. The current usage metrics is available 48-96 hours after online publication and is updated daily on week days.
Initial download of the metrics may take a while.