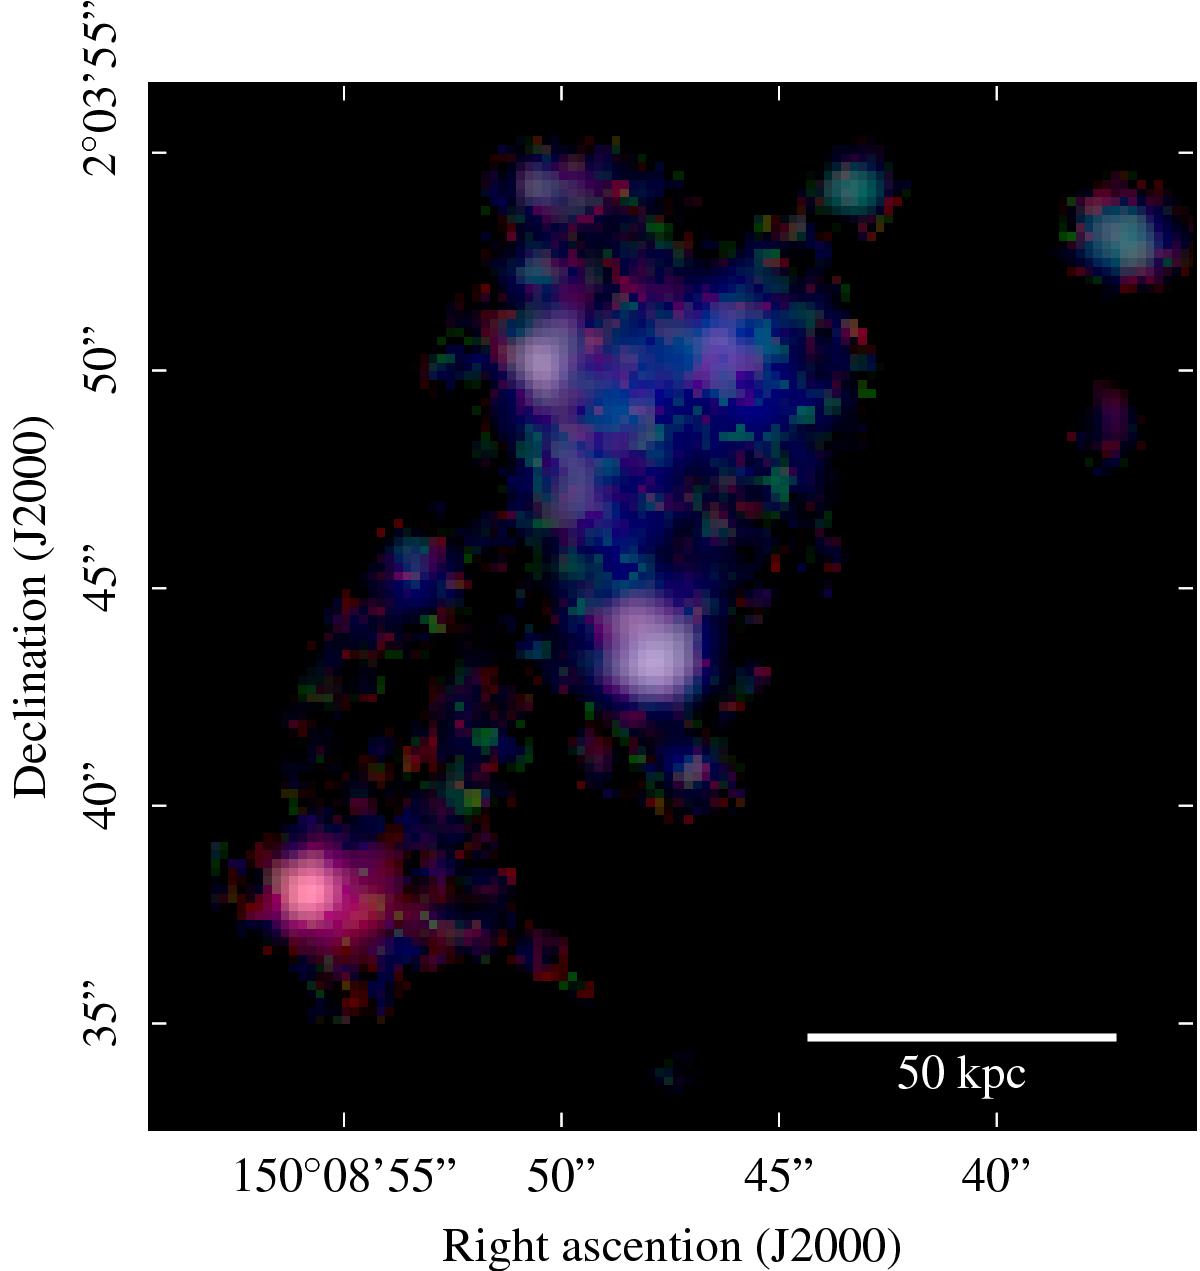
Fig. 4

Flux map of the three main emission lines on a logarithmic scale: the [O iii] doublet in red, Hβ in green and the [O ii] doublet in blue. The Hβ line is noisier than the two doublets. The flux maps were cleaned before display to mask regions with a too low signal-to-noise ratio using a threshold of 1.5 × 10⁻¹⁸ erg s-1 cm-2 arcsec-2 on the [O ii] surface brightness map smoothed using a 0.28′′ FWHM Gaussian. The physical scale at the redshift of the structure is indicated at the bottom right.
Current usage metrics show cumulative count of Article Views (full-text article views including HTML views, PDF and ePub downloads, according to the available data) and Abstracts Views on Vision4Press platform.
Data correspond to usage on the plateform after 2015. The current usage metrics is available 48-96 hours after online publication and is updated daily on week days.
Initial download of the metrics may take a while.


