Free Access
Fig. 3
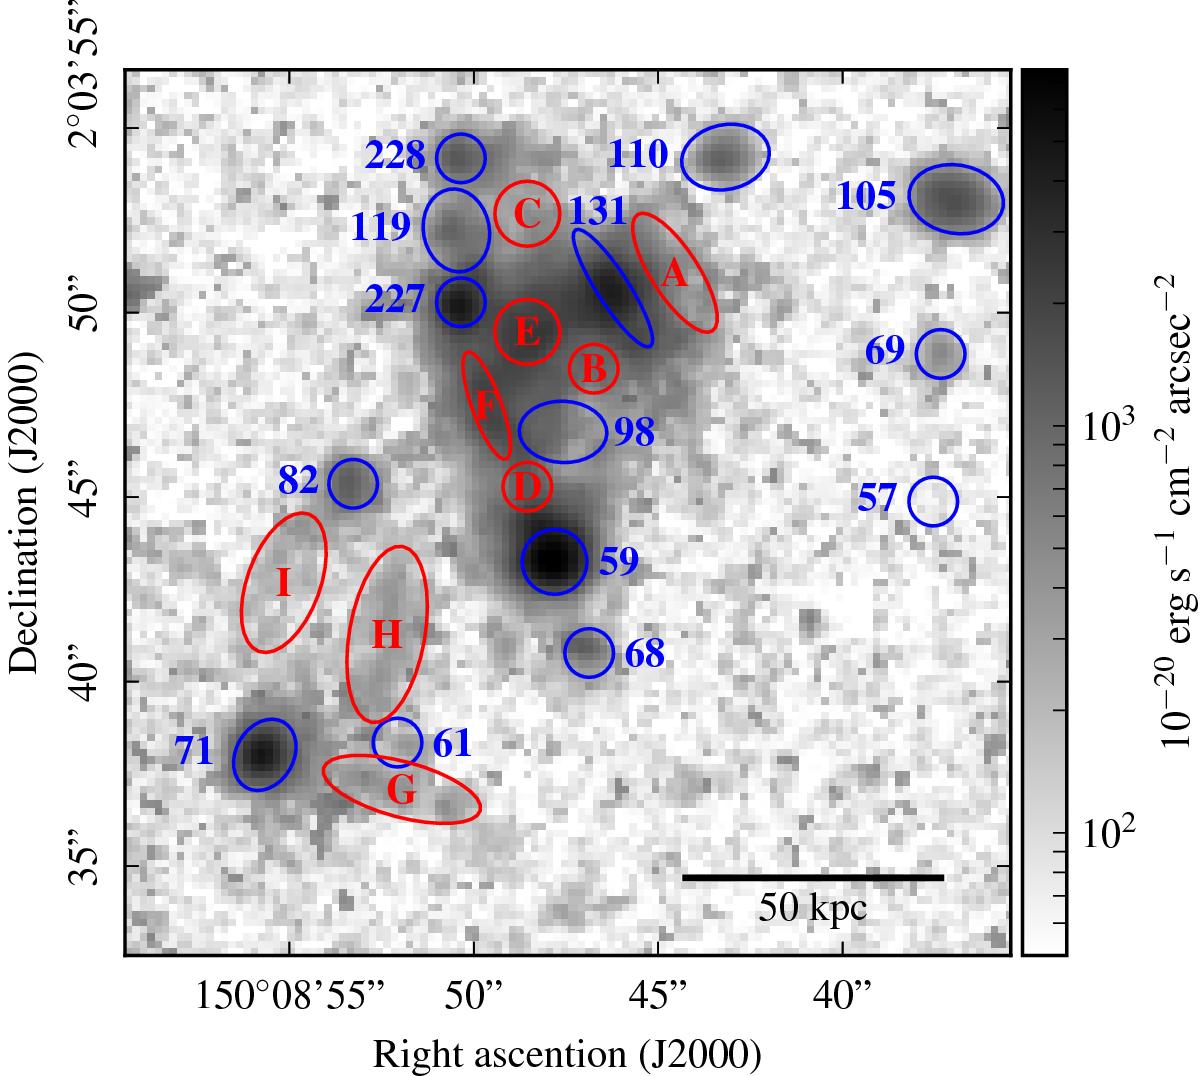
MUSE [O ii]λλ3727, 3729 flux map (logarithmic scale) with apertures defined to extract spectra in red for diffuse emission regions and in blue for group galaxies. The IDs of the extended gas regions and galaxies are indicated. The physical scale at the redshift of the structure is indicated at the bottom right.
Current usage metrics show cumulative count of Article Views (full-text article views including HTML views, PDF and ePub downloads, according to the available data) and Abstracts Views on Vision4Press platform.
Data correspond to usage on the plateform after 2015. The current usage metrics is available 48-96 hours after online publication and is updated daily on week days.
Initial download of the metrics may take a while.