Fig. 11
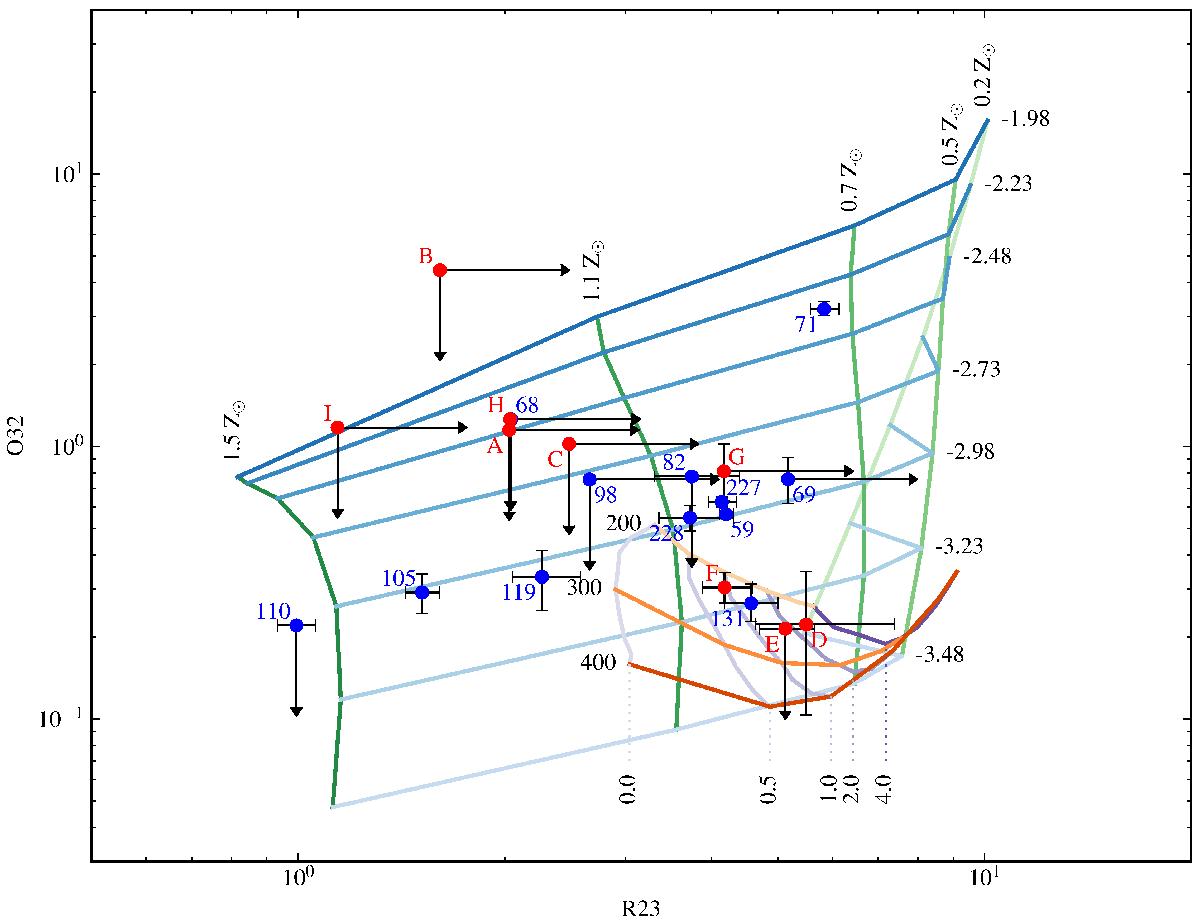
O32 vs. R23 line ratio diagnostic diagram. Blue and red dots correspond to galaxies and extended gas regions, respectively. Their IDs are also indicated. Photo-ionisation models from MAPPINGS V (Sutherland, in prep.) are shown with blue (abundance) and green (ionisation parameter) lines. Shock models from MAPPINGS III (Allen et al. 2008) obtained without precursor assuming an LMC metallicity and a pre-shock density n = 1 cm-3 are shown with purple (magnetic parameter in μG) and orange (shock velocity in km s-1) lines.
Current usage metrics show cumulative count of Article Views (full-text article views including HTML views, PDF and ePub downloads, according to the available data) and Abstracts Views on Vision4Press platform.
Data correspond to usage on the plateform after 2015. The current usage metrics is available 48-96 hours after online publication and is updated daily on week days.
Initial download of the metrics may take a while.