Free Access
Fig. 10
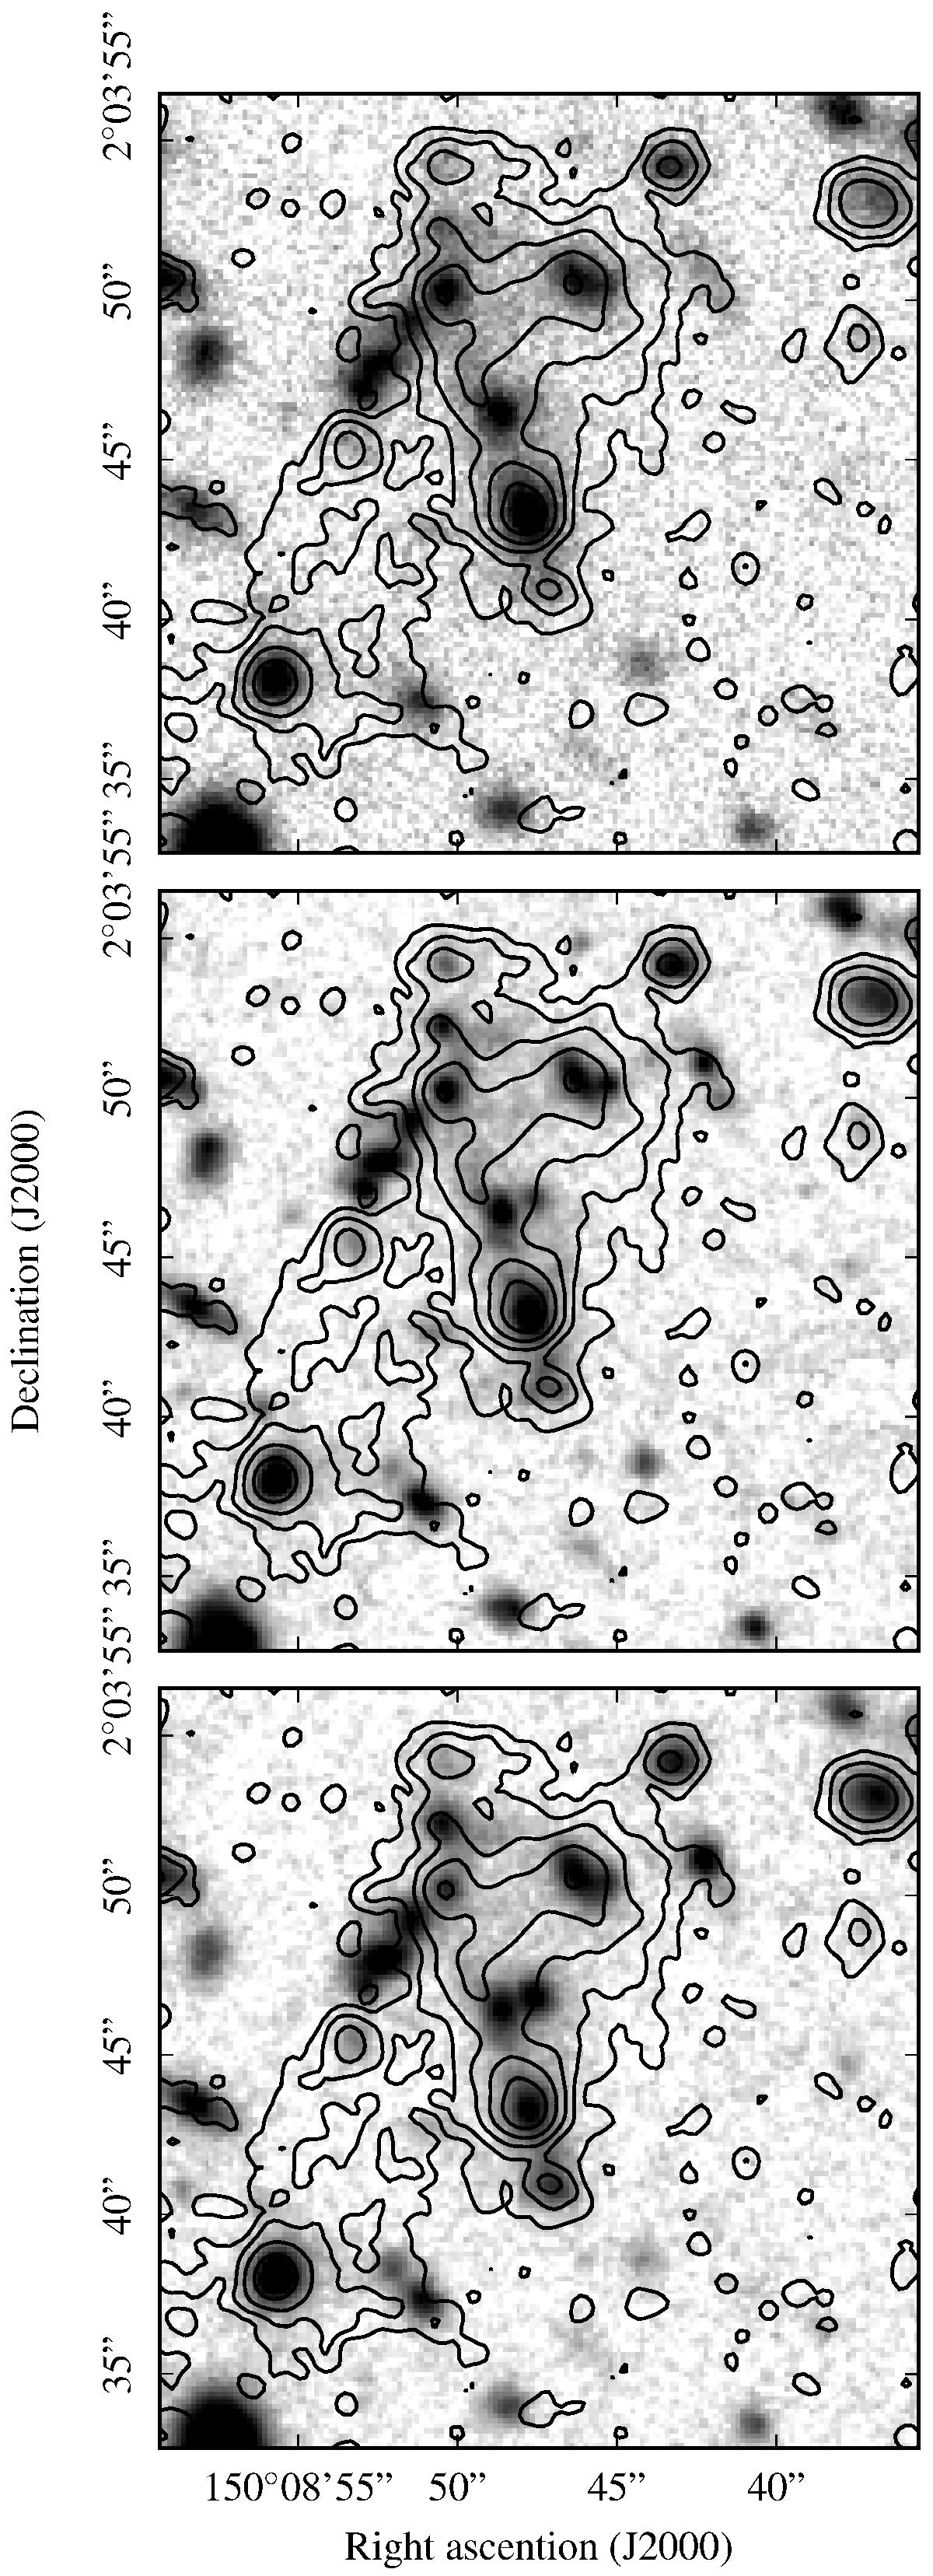
U-band MegaCam/CFHT image (top), B-band (middle), and V-band (bottom) SubprimeCam/Subaru images over the structure using a logarithmic scale and arbitrary units. The same logarithmic [O ii] contours as displayed in Fig. 2 are overlaid on each image.
Current usage metrics show cumulative count of Article Views (full-text article views including HTML views, PDF and ePub downloads, according to the available data) and Abstracts Views on Vision4Press platform.
Data correspond to usage on the plateform after 2015. The current usage metrics is available 48-96 hours after online publication and is updated daily on week days.
Initial download of the metrics may take a while.