Fig. 4
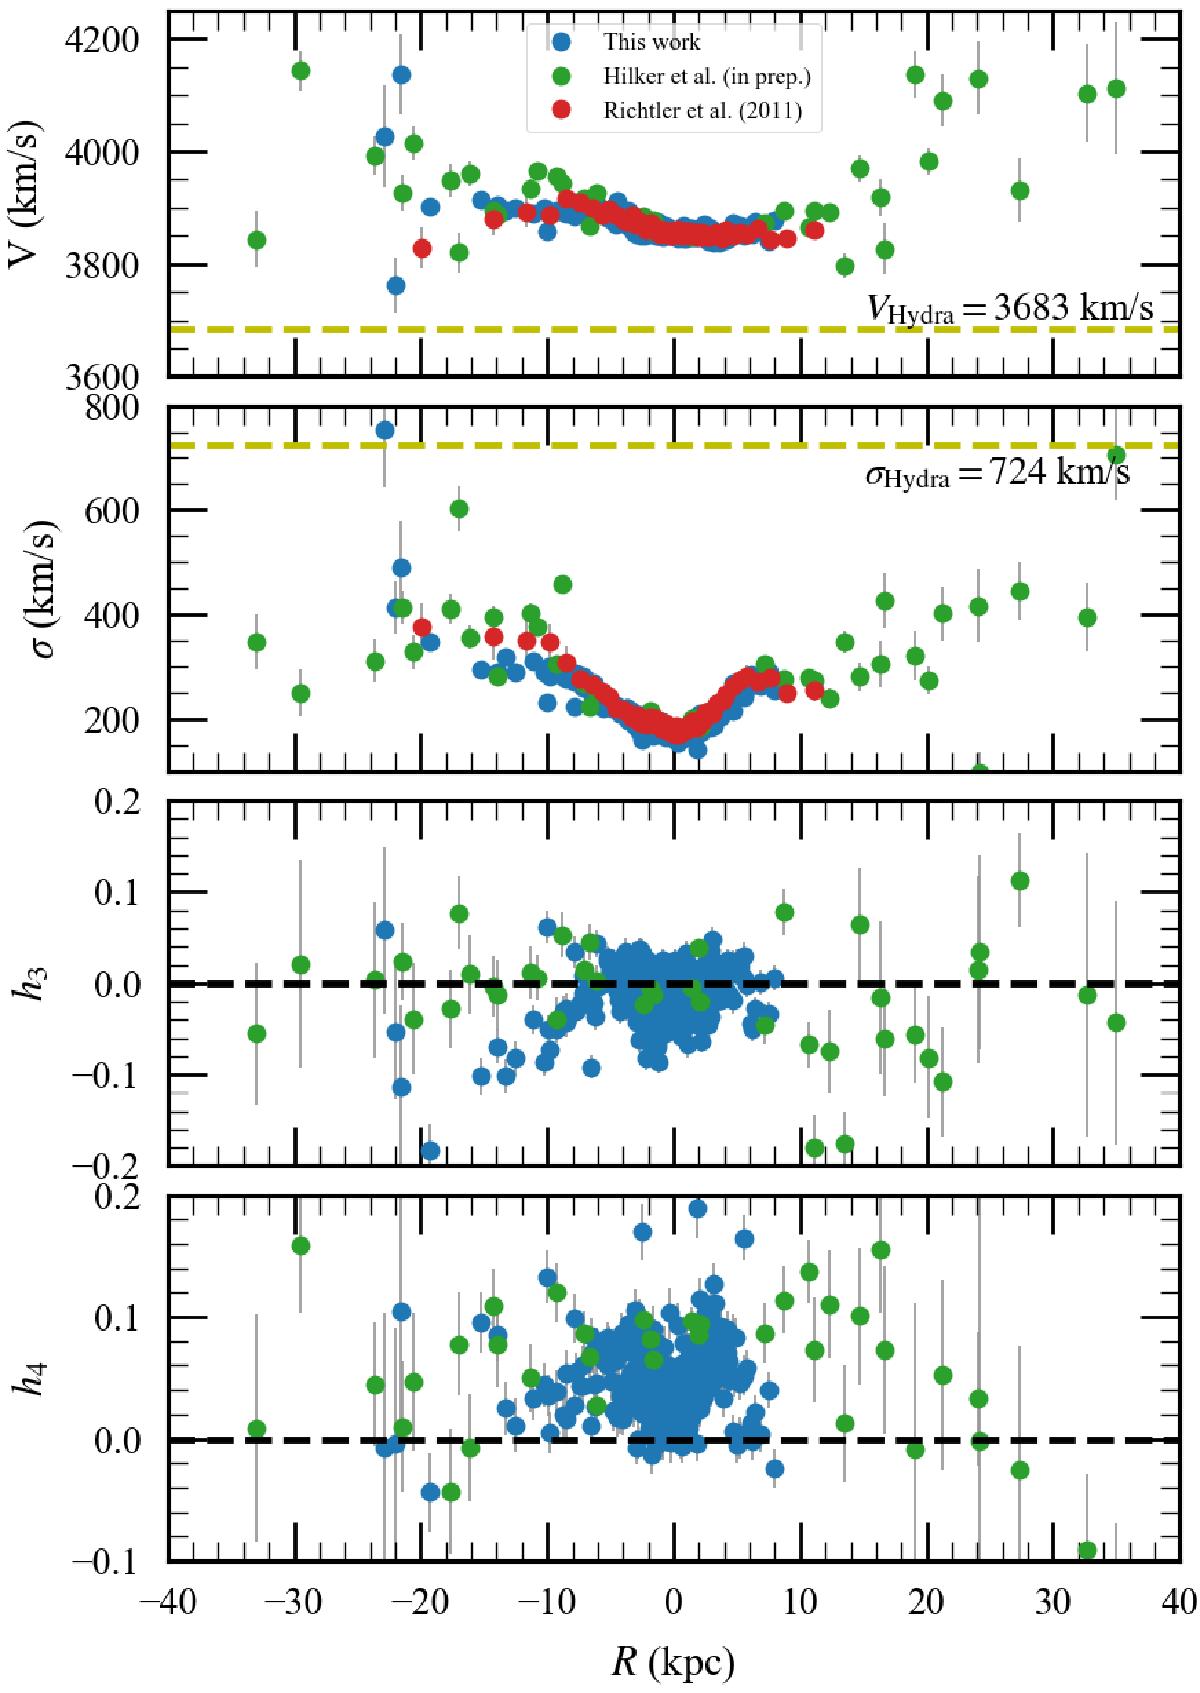
Comparison of the profiles of the four moments of the LOSVDs from this work with literature data. Red circles show the results from long-slit observations of Richtler et al. (2011) at the position angle of 40 ◦ and centered on NGC 3311. Blue (green) circles show the results from this work (Hilker et al. 2017) extracted along the same position angle within a pseudo-slit of 20′′ (40′′) width. The dashed yellow line in the first and second panel indicates the cluster’s velocity and velocity dispersion according to Christlein & Zabludoff (2003). Positive (negative) radius indicate data points towards the southeast (northwest) direction from the center of the galaxy.
Current usage metrics show cumulative count of Article Views (full-text article views including HTML views, PDF and ePub downloads, according to the available data) and Abstracts Views on Vision4Press platform.
Data correspond to usage on the plateform after 2015. The current usage metrics is available 48-96 hours after online publication and is updated daily on week days.
Initial download of the metrics may take a while.