Fig. 3
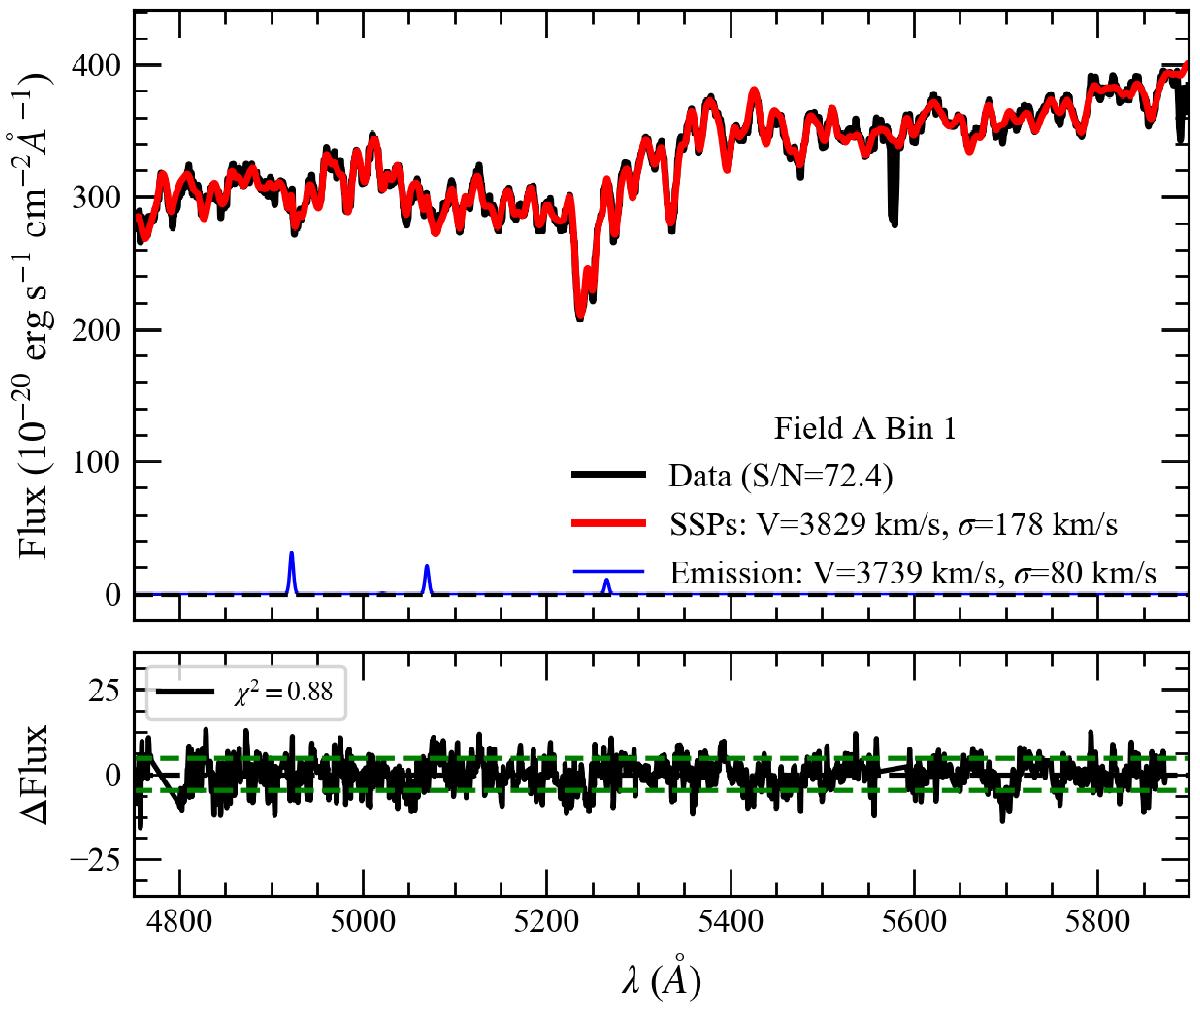
Example of the fitting process with ppxf for the MUSE observations of the Hydra I cluster core. The upper panel displays the observed spectrum (black), the best fit for the stellar component (red), and the best fit for the emission lines (blue). The lower panel shows the residuals of the fitting (solid black) and the standard deviation of the noise (dashed green).
Current usage metrics show cumulative count of Article Views (full-text article views including HTML views, PDF and ePub downloads, according to the available data) and Abstracts Views on Vision4Press platform.
Data correspond to usage on the plateform after 2015. The current usage metrics is available 48-96 hours after online publication and is updated daily on week days.
Initial download of the metrics may take a while.