Free Access
Fig. A.1
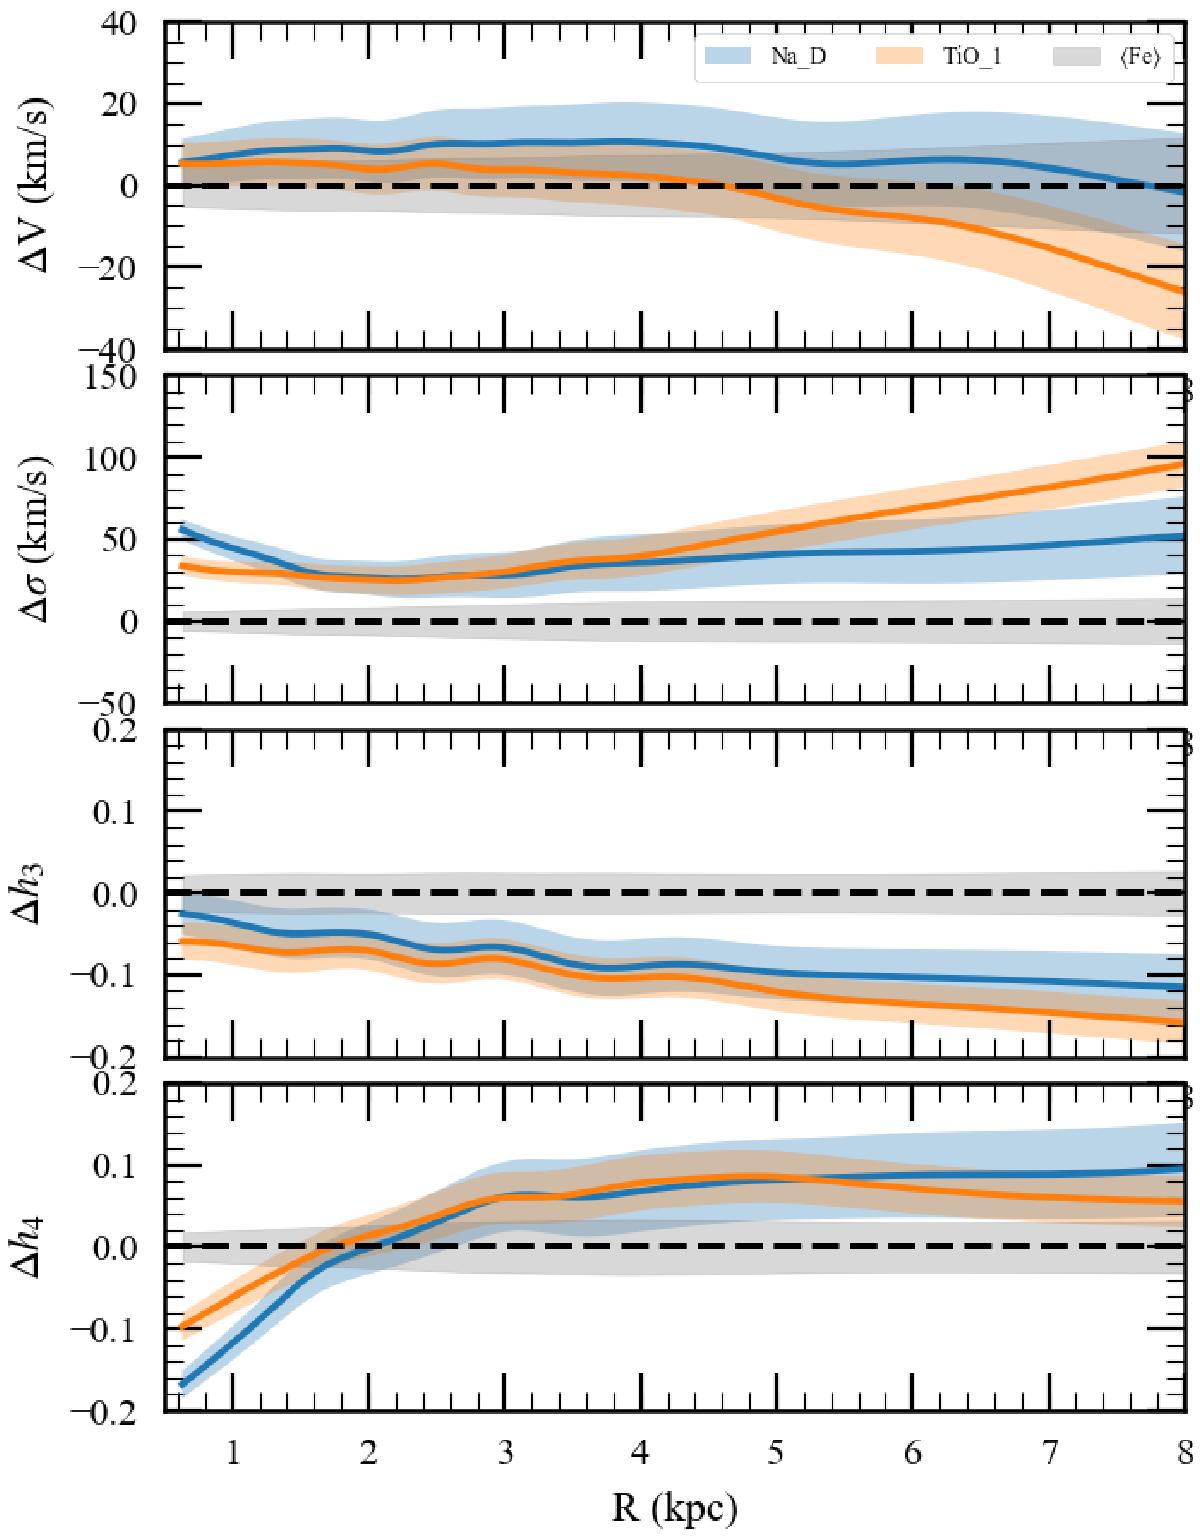
Comparison of the LOSVD moments as a function of radius for the wavelength ranges defined according to the Lick indices in the observed field I. Solid lines display the running average of the measured values, and the shaded areas around the lines indicate the typical standard deviation from the mean.
Current usage metrics show cumulative count of Article Views (full-text article views including HTML views, PDF and ePub downloads, according to the available data) and Abstracts Views on Vision4Press platform.
Data correspond to usage on the plateform after 2015. The current usage metrics is available 48-96 hours after online publication and is updated daily on week days.
Initial download of the metrics may take a while.