Fig. 17
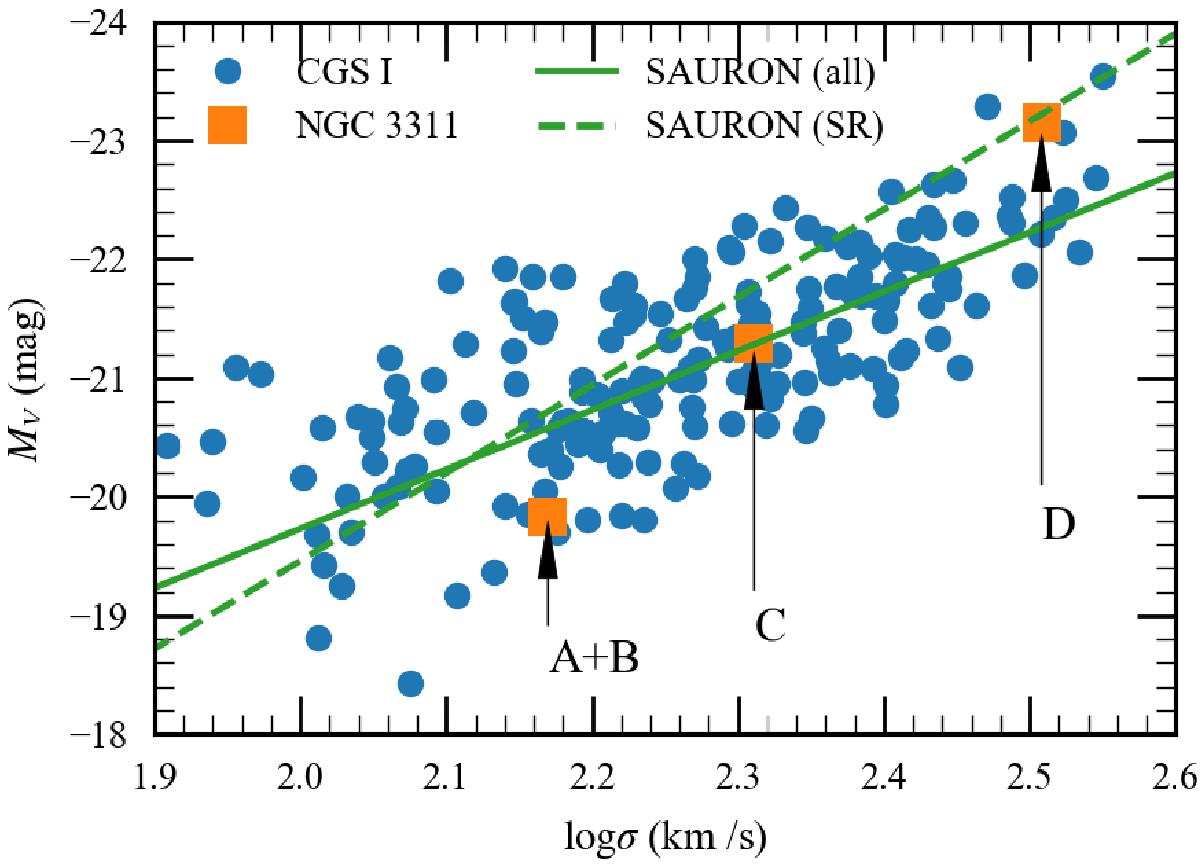
Faber-Jackson relation for the subcomponents in NGC 3311 (orange squares) using the V-band photometric model and the velocity dispersion from the finite mixture model. Blue circles indicate the galaxies in the Carnegie-Irvine Galaxy Survey (Ho et al. 2011), while the green lines indicate the results from the SAURON survey (Falcón-Barroso et al. 2011b), including all galaxies (solid line) and slow rotators (dashed line) only.
Current usage metrics show cumulative count of Article Views (full-text article views including HTML views, PDF and ePub downloads, according to the available data) and Abstracts Views on Vision4Press platform.
Data correspond to usage on the plateform after 2015. The current usage metrics is available 48-96 hours after online publication and is updated daily on week days.
Initial download of the metrics may take a while.