Free Access
Fig. 13
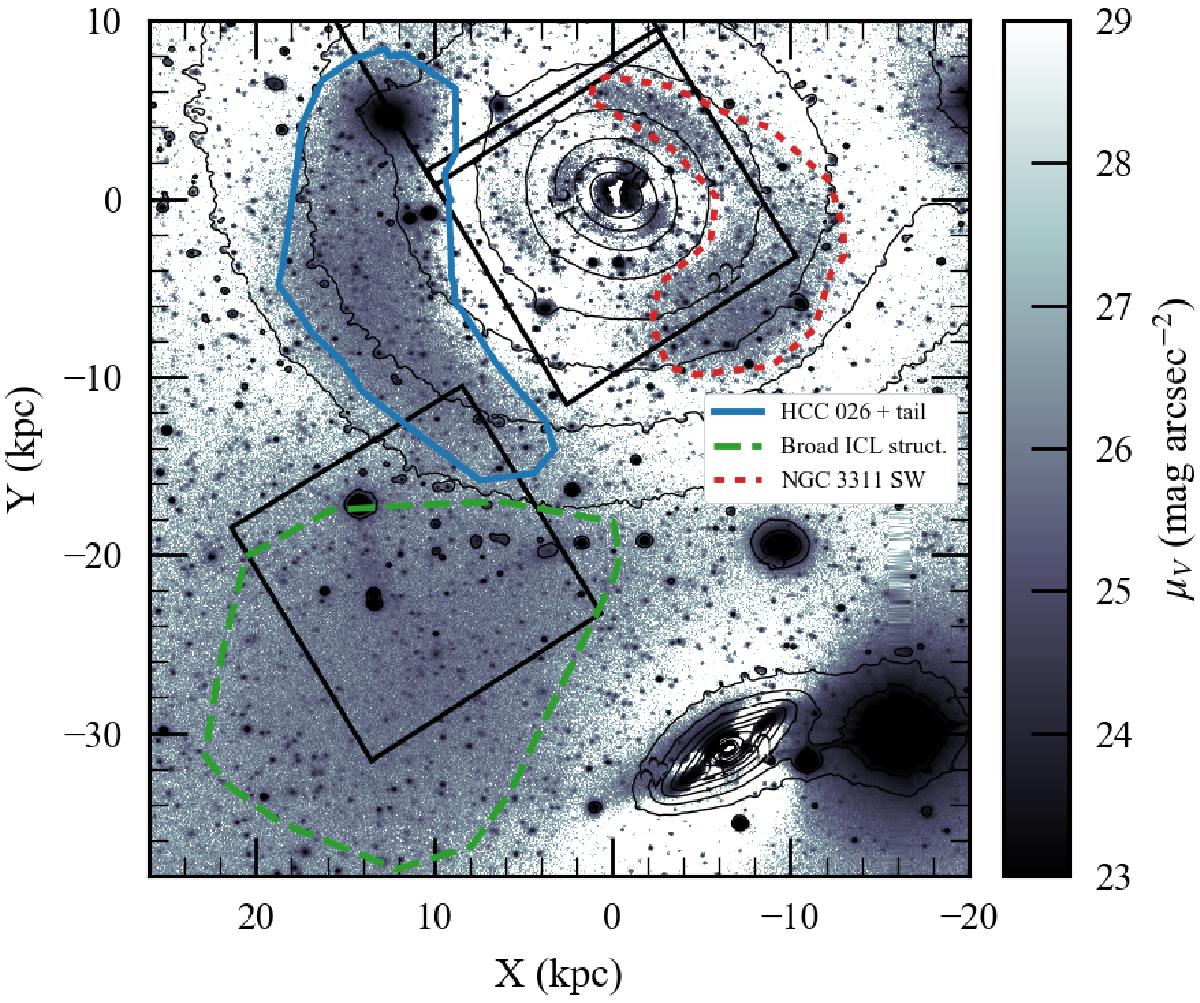
ICL substructures observed in the residual map from the modeling of symmetric structures with galfitm. V-band contours are also shown for reference. Black squares represent the MUSE fields, and the colored polygons represent the three most evident substructures in this region.
Current usage metrics show cumulative count of Article Views (full-text article views including HTML views, PDF and ePub downloads, according to the available data) and Abstracts Views on Vision4Press platform.
Data correspond to usage on the plateform after 2015. The current usage metrics is available 48-96 hours after online publication and is updated daily on week days.
Initial download of the metrics may take a while.