Fig. B.1
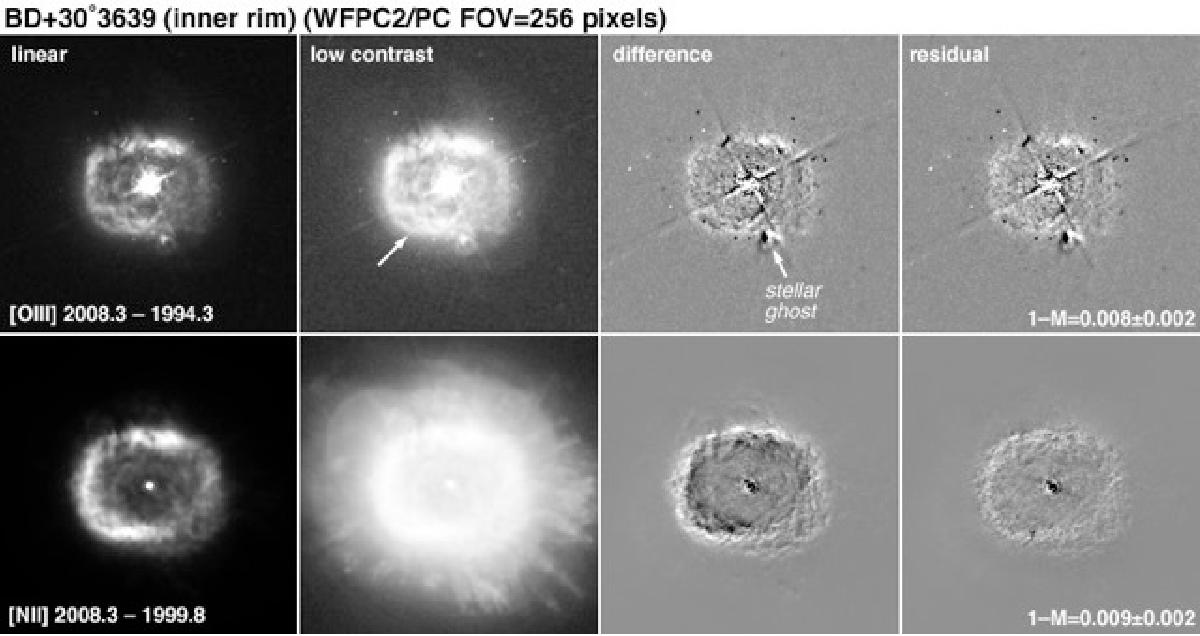
Magnification process for BD +30°3639. In the left two columns, the images in [O iii] and [N ii] are shown. The third column shows the simple difference in corresponding [O iii] and [N ii] images from the two epochs (shown in the image headers). White-black difference patterns are the signatures of global growth between epochs. The residuals (fourth column) are similar to the difference images except that the earlier image was magnified by a factor M before the images were subtracted. The value of M is determined (by trial and error) to null the residual image as much as possible.
Current usage metrics show cumulative count of Article Views (full-text article views including HTML views, PDF and ePub downloads, according to the available data) and Abstracts Views on Vision4Press platform.
Data correspond to usage on the plateform after 2015. The current usage metrics is available 48-96 hours after online publication and is updated daily on week days.
Initial download of the metrics may take a while.