Free Access
Fig. 6
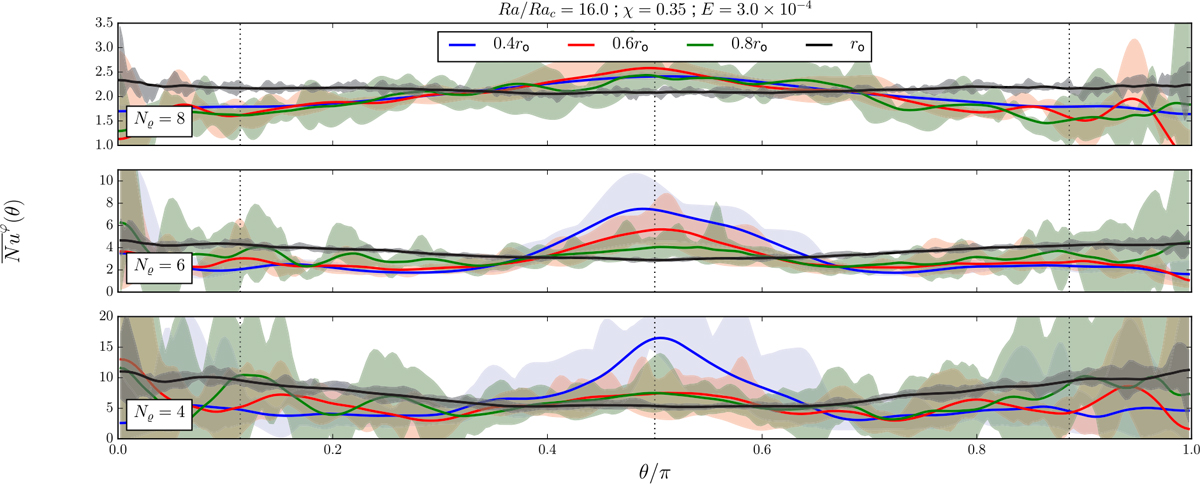
Nusselt profiles as a function of colatitude at different depths, for different density stratification. A running average in latitude has been applied to the mean profiles (solid lines) and the shaded areas highlight the fluctuation envelopes.
Current usage metrics show cumulative count of Article Views (full-text article views including HTML views, PDF and ePub downloads, according to the available data) and Abstracts Views on Vision4Press platform.
Data correspond to usage on the plateform after 2015. The current usage metrics is available 48-96 hours after online publication and is updated daily on week days.
Initial download of the metrics may take a while.