Free Access
Fig. 2
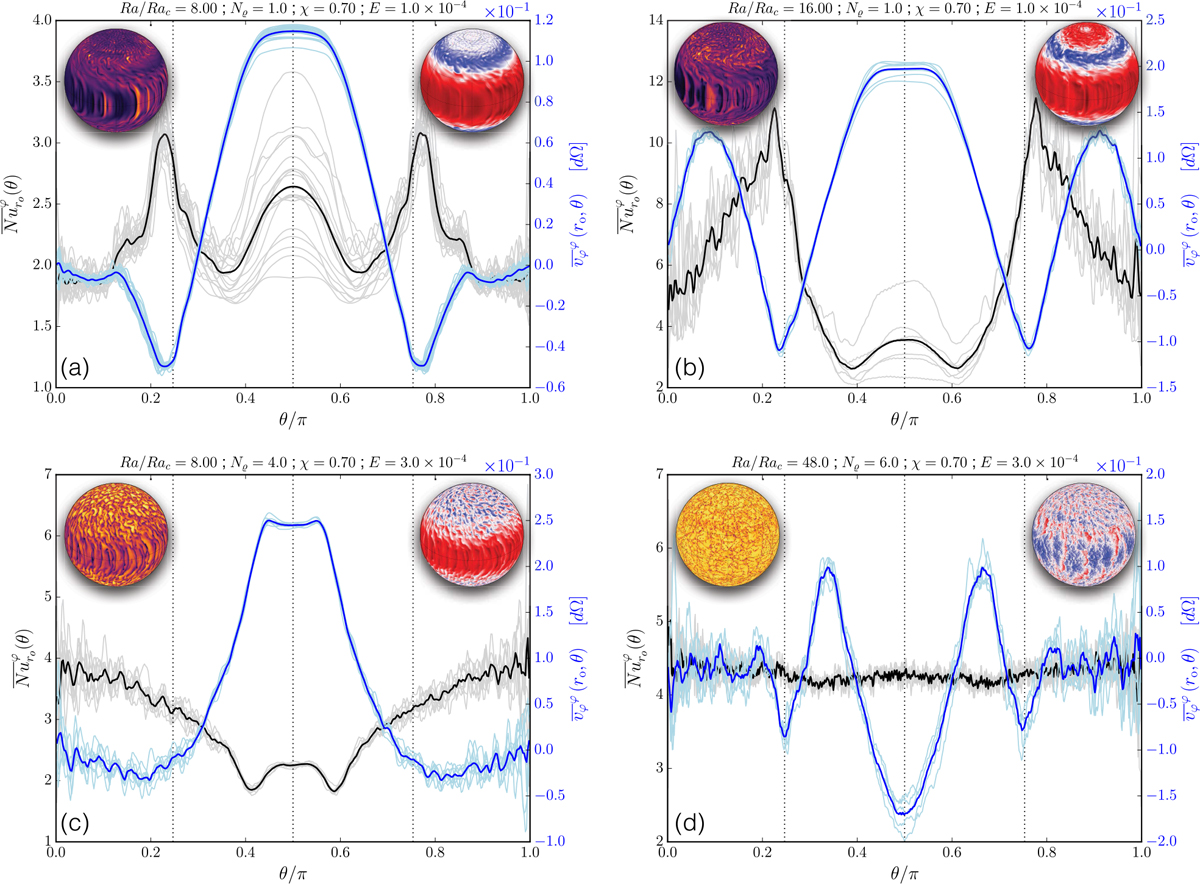
Nusselt (black) and zonal velocity (blue) profiles as a function of colatitude for different thin shell models. The colour insets represent snapshots of S(r = 0.98ro) and vφ (r = ro). The positions of the equator and the tangent cylinder are indicated by vertical dotted lines.
Current usage metrics show cumulative count of Article Views (full-text article views including HTML views, PDF and ePub downloads, according to the available data) and Abstracts Views on Vision4Press platform.
Data correspond to usage on the plateform after 2015. The current usage metrics is available 48-96 hours after online publication and is updated daily on week days.
Initial download of the metrics may take a while.