Free Access
Fig. 7
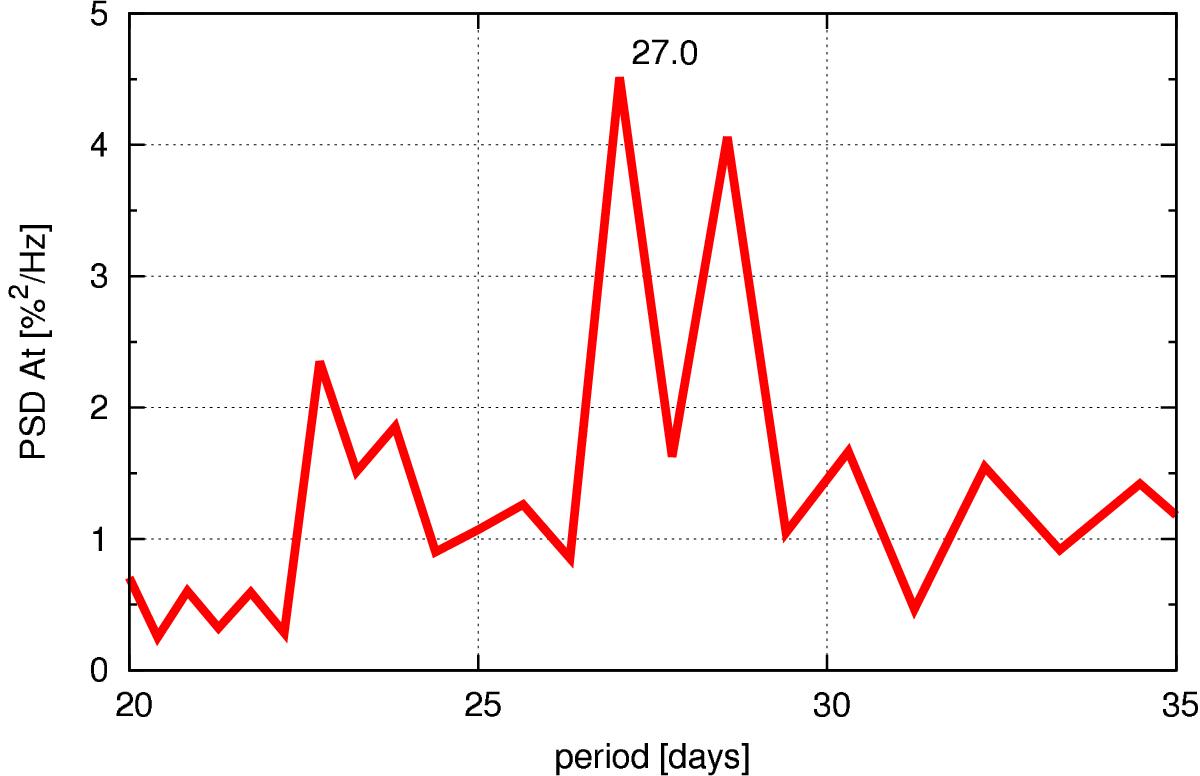
Spectral analysis of the At component of the 3D GCR anisotropy for 1970−2006, the highest peak is for the period of 27 days with 95% confidence level.
Current usage metrics show cumulative count of Article Views (full-text article views including HTML views, PDF and ePub downloads, according to the available data) and Abstracts Views on Vision4Press platform.
Data correspond to usage on the plateform after 2015. The current usage metrics is available 48-96 hours after online publication and is updated daily on week days.
Initial download of the metrics may take a while.