Free Access
Fig. 3
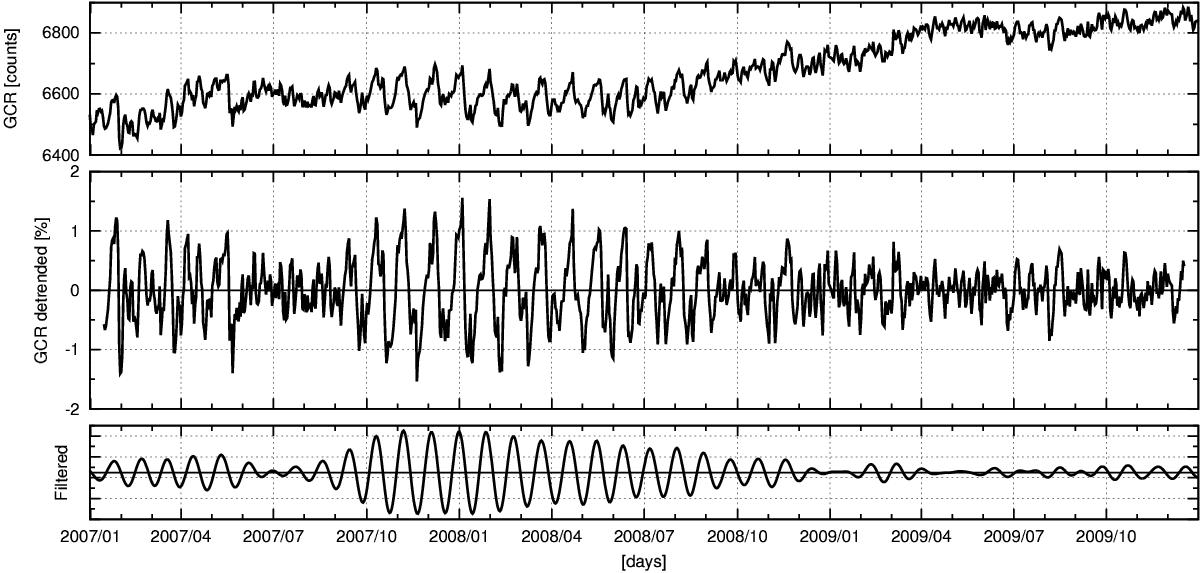
Temporal changes of the daily GCR intensity for Oulu NM for the period of 2007−2009 (top) and corresponding to this period the same data detrended over 29 days (middle) and filtered periodic oscillation with the band-pass period within 24−32 days (bottom).
Current usage metrics show cumulative count of Article Views (full-text article views including HTML views, PDF and ePub downloads, according to the available data) and Abstracts Views on Vision4Press platform.
Data correspond to usage on the plateform after 2015. The current usage metrics is available 48-96 hours after online publication and is updated daily on week days.
Initial download of the metrics may take a while.