Free Access
Fig. 8

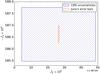
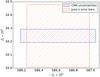
Comparison of the errors of the CMS method from quadratic and HM16 repartitions with Juno’s error bars, shifted to be centered on the observed Jn. a) −J4 × 106 vs. J2 × 106 from test 1; b) J6 × 106 vs. −J4 × 106 from test 3, when J2 is fit.
This figure is made of several images, please see below:
Current usage metrics show cumulative count of Article Views (full-text article views including HTML views, PDF and ePub downloads, according to the available data) and Abstracts Views on Vision4Press platform.
Data correspond to usage on the plateform after 2015. The current usage metrics is available 48-96 hours after online publication and is updated daily on week days.
Initial download of the metrics may take a while.