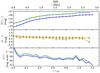
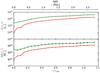
Fig. 3

Photometric and stellar mass profiles of the cluster A85. Left panel, upper plot: integrated magnitude profiles, where the blue lines correspond to the B-band data and green lines to the V-band data, are shown. Left panel, central plot: the color index profile, where the orange lines correspond to the integrated color index (B − V)( ≤ r) and yellow lines to the local color index (B − V)(r) are shown. Left panel, lower plot: surface brightness profiles, with the same color code of the upper plot, are shown. Right panel, upper plot: V-band integrated luminosity profile for the objects in the photometric (green line) and spectroscopic (red line) samples are shown. Right panel, lower plot: the integrated mass profile for the objects in the photometric and spectroscopic samples, with the same color code as the upper plot, is shown.
Current usage metrics show cumulative count of Article Views (full-text article views including HTML views, PDF and ePub downloads, according to the available data) and Abstracts Views on Vision4Press platform.
Data correspond to usage on the plateform after 2015. The current usage metrics is available 48-96 hours after online publication and is updated daily on week days.
Initial download of the metrics may take a while.