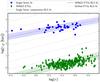
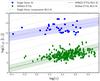
Fig. 15

Correlations of reff − n and Leff − n in log units for ETGs (green dots) and clusters (blue dots). The gray dashed lines are parallel to the BLS fit of the WINGS ETGs. The bold gray dashed line indicates the BLS fit of our clusters. The filled areas identify the limits of the RMS standard deviation of the observed distributions with the same color code of the sample to which they refer.
Current usage metrics show cumulative count of Article Views (full-text article views including HTML views, PDF and ePub downloads, according to the available data) and Abstracts Views on Vision4Press platform.
Data correspond to usage on the plateform after 2015. The current usage metrics is available 48-96 hours after online publication and is updated daily on week days.
Initial download of the metrics may take a while.