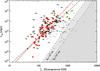
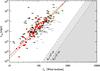
Fig. 7

Correlation between the isotropic equivalent luminosity Liso and the bulk Lorentz factor Γ0. Estimates of Γ0 from the measured afterglow onset tp for 68 long GRBs (red filled circles and green filled stars) and the short GRB 090510 (green filled square symbol). Lower limits ![]() (derived from upper limits on the onset time
(derived from upper limits on the onset time ![]() ) are shown by the rightward black arrows. Upper limits
) are shown by the rightward black arrows. Upper limits ![]() (derived assuming that the afterglow onset time is larger than the peak time of the prompt emission, that is, tp ≥ Tp,γ) are shown by the grey (leftward) arrows. Upper limit on Γ0 imposed by the requirement that the deceleration radius is larger than the transparency radius is shown by the grey shaded triangular region (for two values of the radius R0 where the fireball is formed – see Eq. (16)). The solid red line shows the correlation obtained with Γ0 solely (bisector method), while the black dot–dashed line is the correlation obtained through the Monte Carlo method which accounts for the reconstructed distribution of Γ0. Left and right panels show the case of a homogeneous and wind medium, respectively.
(derived assuming that the afterglow onset time is larger than the peak time of the prompt emission, that is, tp ≥ Tp,γ) are shown by the grey (leftward) arrows. Upper limit on Γ0 imposed by the requirement that the deceleration radius is larger than the transparency radius is shown by the grey shaded triangular region (for two values of the radius R0 where the fireball is formed – see Eq. (16)). The solid red line shows the correlation obtained with Γ0 solely (bisector method), while the black dot–dashed line is the correlation obtained through the Monte Carlo method which accounts for the reconstructed distribution of Γ0. Left and right panels show the case of a homogeneous and wind medium, respectively.
Current usage metrics show cumulative count of Article Views (full-text article views including HTML views, PDF and ePub downloads, according to the available data) and Abstracts Views on Vision4Press platform.
Data correspond to usage on the plateform after 2015. The current usage metrics is available 48-96 hours after online publication and is updated daily on week days.
Initial download of the metrics may take a while.