Fig. 6
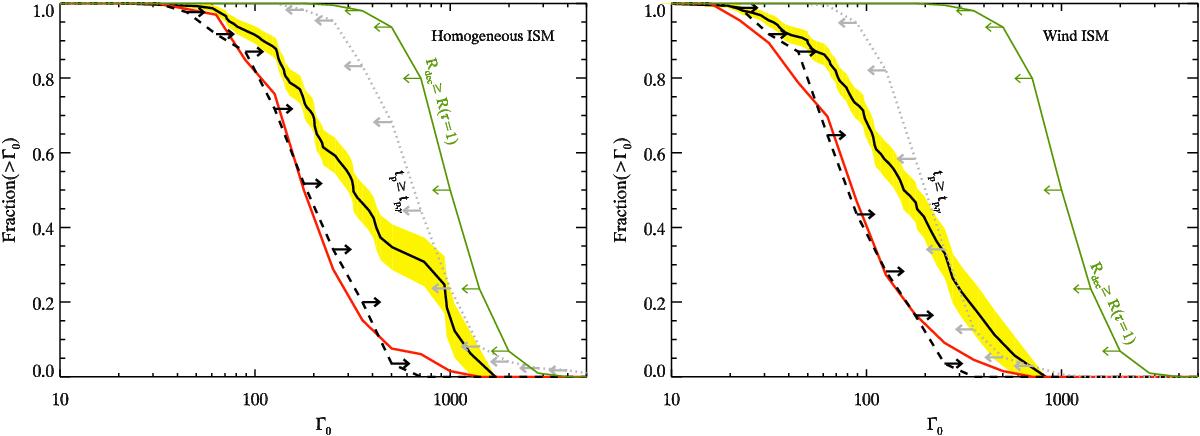
Cumulative distribution of Γ0 for GRBs with measured tp (red solid line). The distribution of lower limits ![]() , derived for GRBs with an upper limit on the onset time
, derived for GRBs with an upper limit on the onset time ![]() , is shown by the dashed black curve (with rightward arrows). Assuming tp ≥ Tp,γ the distribution of upper limits on Γ0 is shown by the dotted grey line (with leftward arrows). The most stringent limit on the distribution of Γ0 is shown by the green solid line which assumes that deceleration radius Rdec ≥ R(τ = 1), that is, the transparency radius (Eq. (16)). Joining estimates of Γ0 and lower limits
, is shown by the dashed black curve (with rightward arrows). Assuming tp ≥ Tp,γ the distribution of upper limits on Γ0 is shown by the dotted grey line (with leftward arrows). The most stringent limit on the distribution of Γ0 is shown by the green solid line which assumes that deceleration radius Rdec ≥ R(τ = 1), that is, the transparency radius (Eq. (16)). Joining estimates of Γ0 and lower limits ![]() the reconstructed (through the KM estimator) distribution of Γ0 is shown by the solid black line (and its 95% uncertainty by the yellow shaded region). The distributions are normalised to their respective number of elements. The two panels (right and left, respectively) show the case of a homogeneous (s = 0) and wind (s = 2) medium.
the reconstructed (through the KM estimator) distribution of Γ0 is shown by the solid black line (and its 95% uncertainty by the yellow shaded region). The distributions are normalised to their respective number of elements. The two panels (right and left, respectively) show the case of a homogeneous (s = 0) and wind (s = 2) medium.
Current usage metrics show cumulative count of Article Views (full-text article views including HTML views, PDF and ePub downloads, according to the available data) and Abstracts Views on Vision4Press platform.
Data correspond to usage on the plateform after 2015. The current usage metrics is available 48-96 hours after online publication and is updated daily on week days.
Initial download of the metrics may take a while.