Fig. 4
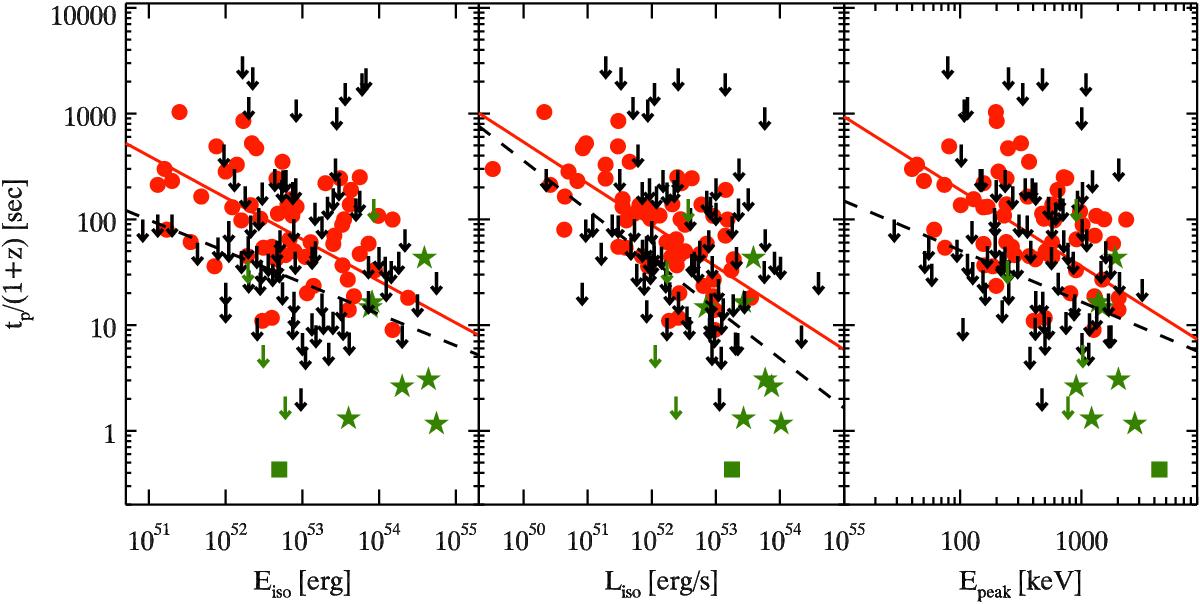
Left panel: tp/ (1 + z) vs. Eiso. GRBs with estimates of tp are shown with filled red circles (green symbols for LAT events). Upper limits on tp (Table A.1) are shown by the black arrows (green arrows for LAT events). Middle panel: tp/ (1 + z) vs. Liso. Right panel: tp/ (1 + z) vs. Ep. In all panels the short GRB 090510 is shown by the green square symbol.
Current usage metrics show cumulative count of Article Views (full-text article views including HTML views, PDF and ePub downloads, according to the available data) and Abstracts Views on Vision4Press platform.
Data correspond to usage on the plateform after 2015. The current usage metrics is available 48-96 hours after online publication and is updated daily on week days.
Initial download of the metrics may take a while.