Fig. 3
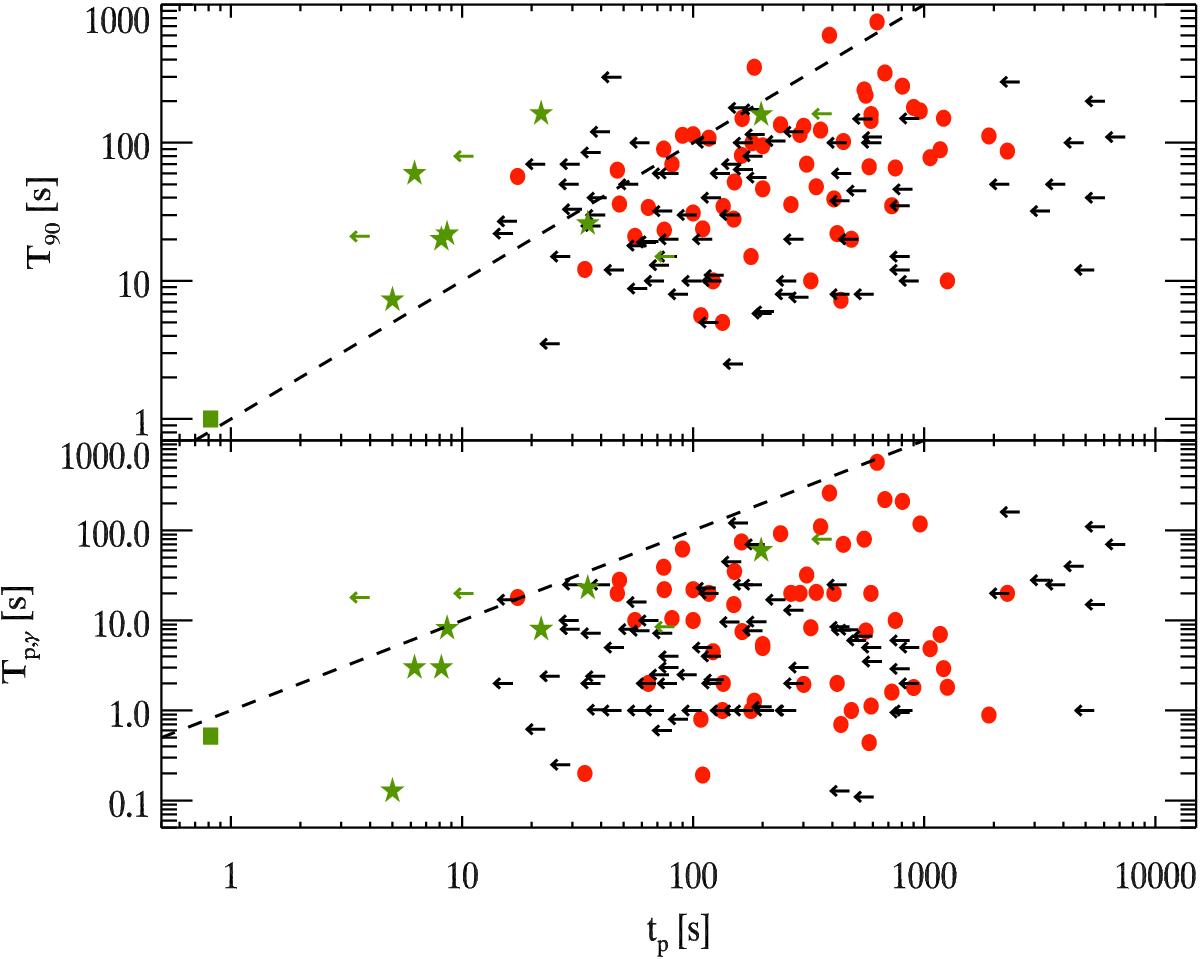
Top panel: GRB duration T90 vs. afterglow peak time tp. GRBs with measured tp are shown with red circles (green stars for LAT bursts). Upper limits on tp are shown by the black arrows (green arrows for LAT GRBs). Bottom panel: time of the peak of the prompt emission light curve Tp,γ vs. tp. Same symbols and colours as in the top panel. In both panels the equality is shown by the dashed line and the short GRB 090510 is shown by the green square.
Current usage metrics show cumulative count of Article Views (full-text article views including HTML views, PDF and ePub downloads, according to the available data) and Abstracts Views on Vision4Press platform.
Data correspond to usage on the plateform after 2015. The current usage metrics is available 48-96 hours after online publication and is updated daily on week days.
Initial download of the metrics may take a while.