Fig. 1
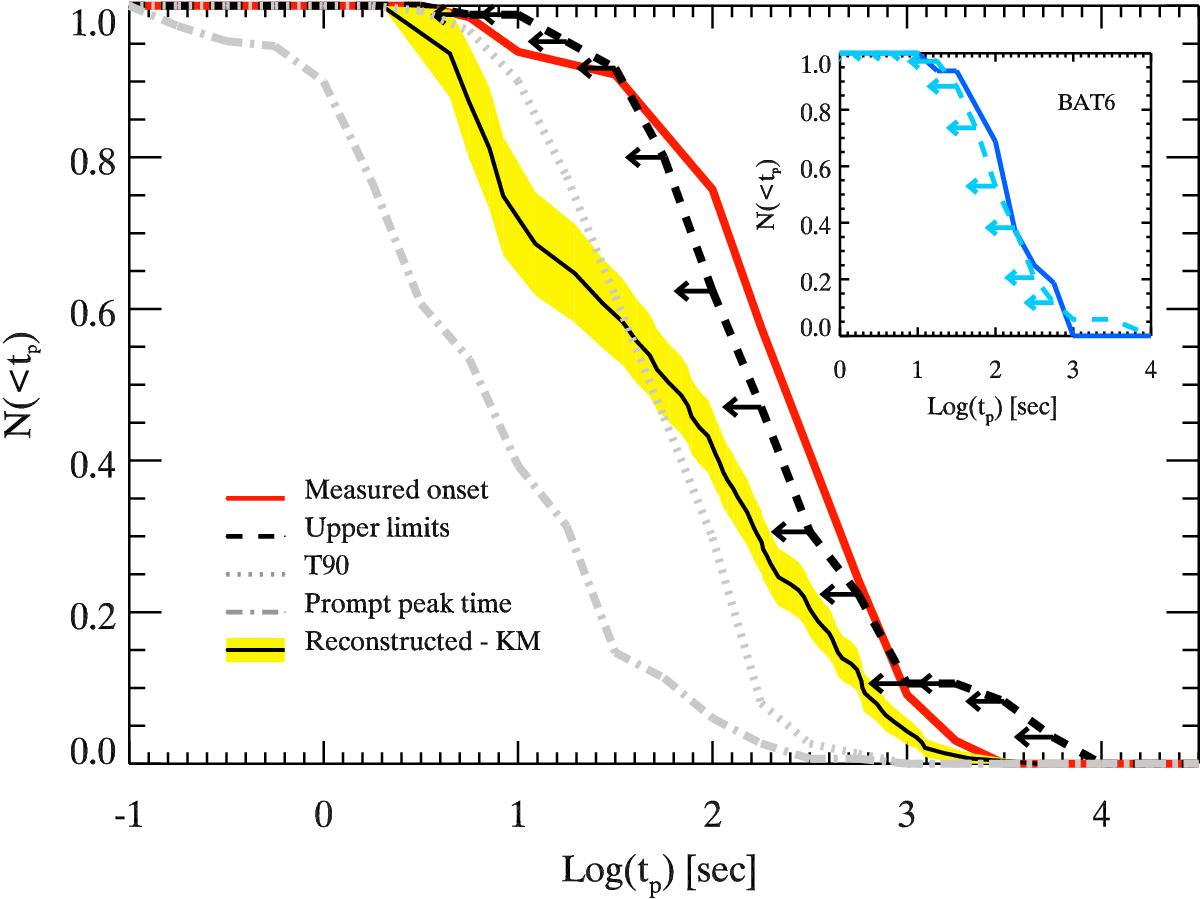
Cumulative distribution of the afterglow onset time tp (red solid line) in the observer frame for the 66 long GRBs of the “Gold+Silver” sample. The black dashed line (marked with leftward arrows) is the cumulative distribution of 85 upper limits on tp (filtered from Table A.1 according to ![]() s). The black solid line (shaded yellow region) is the reconstructed tp distribution (95% confidence interval) accounting for
s). The black solid line (shaded yellow region) is the reconstructed tp distribution (95% confidence interval) accounting for ![]() through the Kaplan Meier estimator. The dotted and dot–dashed lines are the cumulative distributions of T90 and Tp,γ (i.e. the time of the peak of the prompt emission light curve), respectively, for the 151 long GRBs. The distributions have been normalised to the respective sample size. Insert: Distribution of tp (solid blue line) and of upper limits
through the Kaplan Meier estimator. The dotted and dot–dashed lines are the cumulative distributions of T90 and Tp,γ (i.e. the time of the peak of the prompt emission light curve), respectively, for the 151 long GRBs. The distributions have been normalised to the respective sample size. Insert: Distribution of tp (solid blue line) and of upper limits ![]() (dashed cyan line with leftward arrows) of the 50 GRBs of our sample (16 with tp and 34 with
(dashed cyan line with leftward arrows) of the 50 GRBs of our sample (16 with tp and 34 with ![]() ) also present in the Swift BAT complete sample (Salvaterra et al. 2012).
) also present in the Swift BAT complete sample (Salvaterra et al. 2012).
Current usage metrics show cumulative count of Article Views (full-text article views including HTML views, PDF and ePub downloads, according to the available data) and Abstracts Views on Vision4Press platform.
Data correspond to usage on the plateform after 2015. The current usage metrics is available 48-96 hours after online publication and is updated daily on week days.
Initial download of the metrics may take a while.