Free Access
Fig. 15
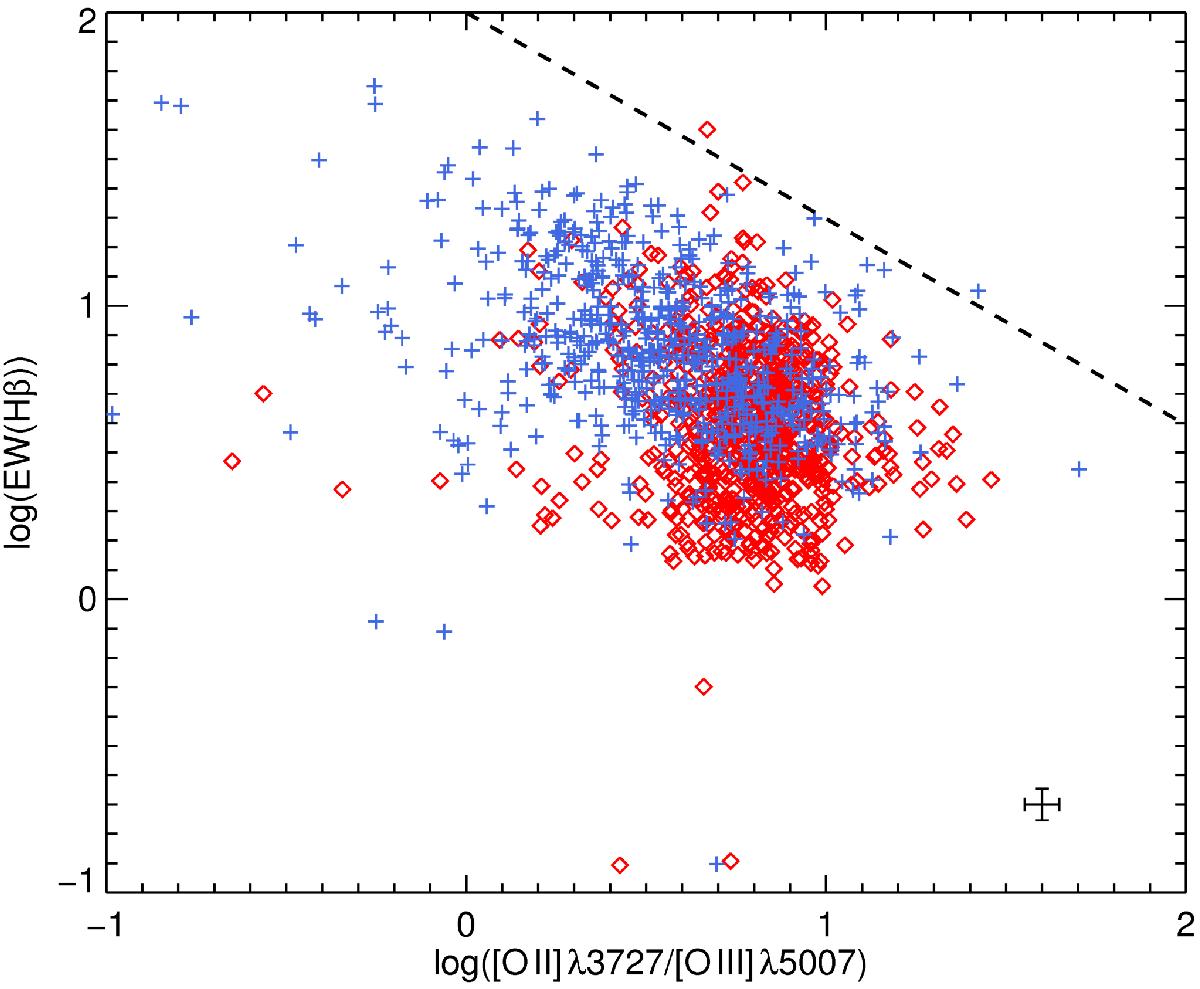
Relation between EW(Hβ) and [O ii] λ3727/[O iii] λ5007 emission-line ratio for the inner (red diamonds) and outer (blue crosses) regions samples. Overplotted as a dashed black line is the relation given by Hoyos & Díaz (2006), explained in the text.
Current usage metrics show cumulative count of Article Views (full-text article views including HTML views, PDF and ePub downloads, according to the available data) and Abstracts Views on Vision4Press platform.
Data correspond to usage on the plateform after 2015. The current usage metrics is available 48-96 hours after online publication and is updated daily on week days.
Initial download of the metrics may take a while.