Fig. 14
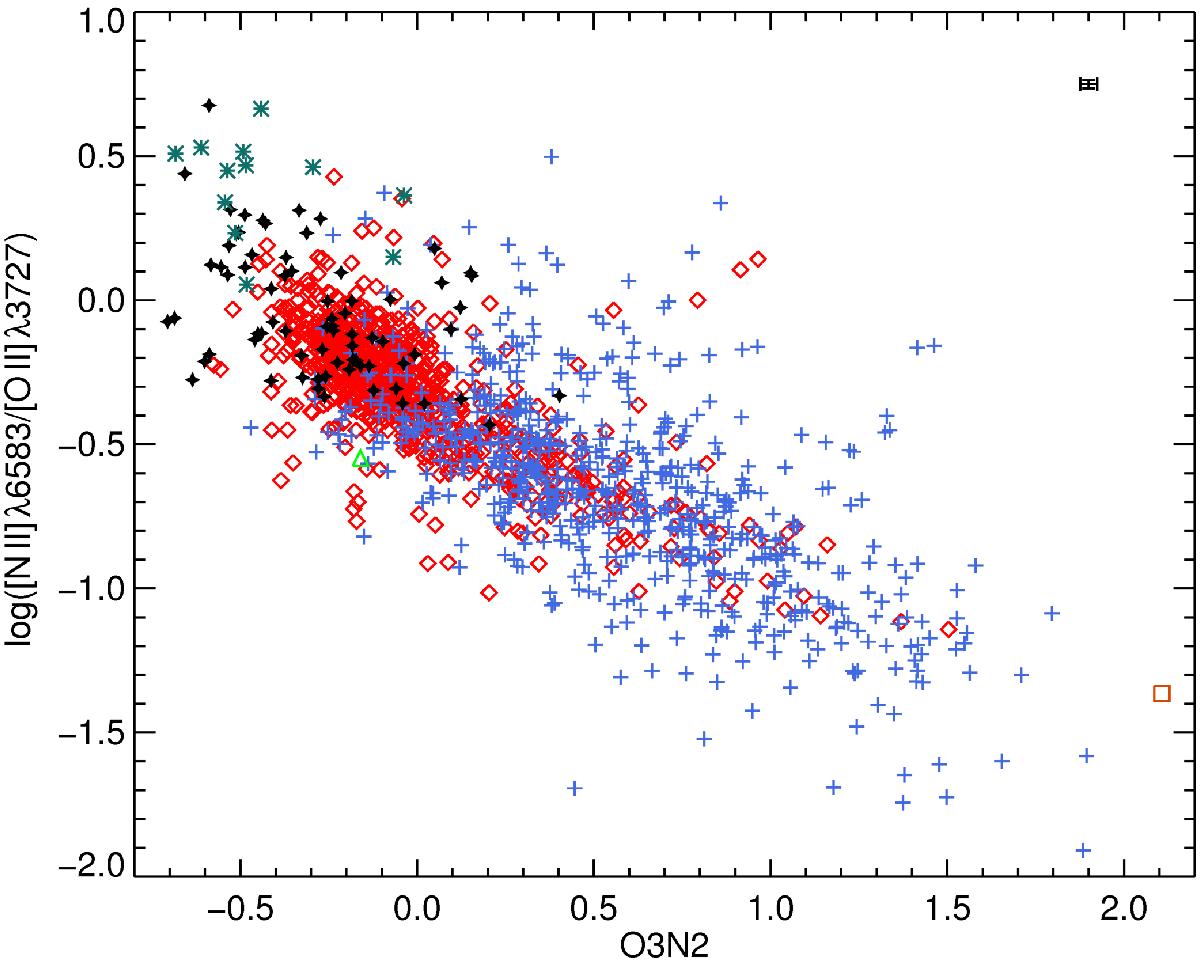
Relation between [N ii] λ6583/[O ii] λ3727 emission-line ratio and the O3N2 index for the CALIFA inner (red diamonds) and outer (blue crosses) region samples. Data from PINGS inner region sample (black stars), from CNSFR (dark green asterisks) studied by Díaz et al. (2007) and from central region (light green triangle) and IC 132 H ii region of M33 (orange square) studied by López-Hernández et al. (2013) are also included for comparison.
Current usage metrics show cumulative count of Article Views (full-text article views including HTML views, PDF and ePub downloads, according to the available data) and Abstracts Views on Vision4Press platform.
Data correspond to usage on the plateform after 2015. The current usage metrics is available 48-96 hours after online publication and is updated daily on week days.
Initial download of the metrics may take a while.