Fig. 12
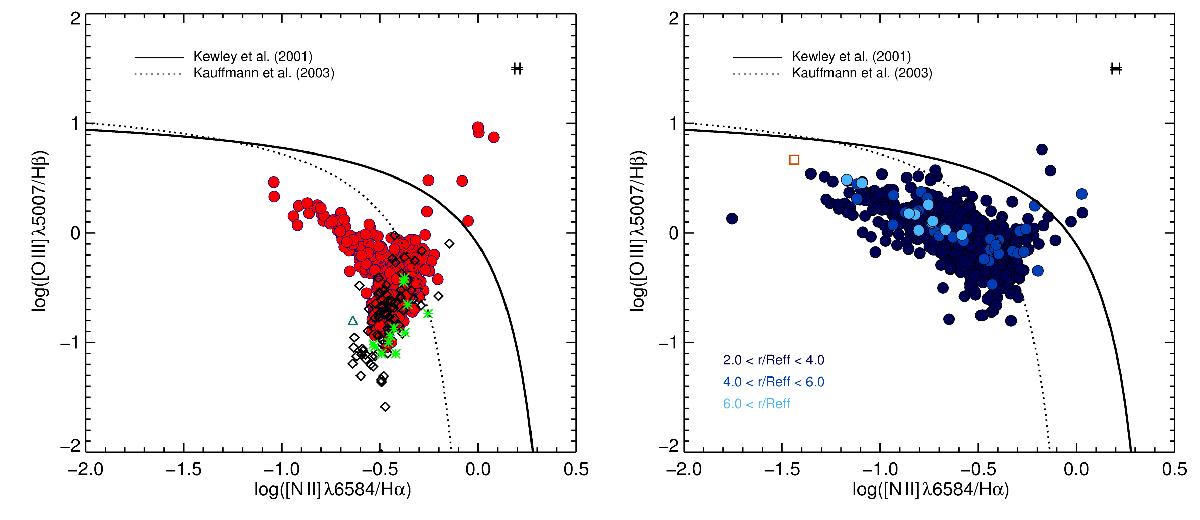
Left: diagnostic diagram of the CALIFA inner region sample (red circles). Data from PINGS inner region sample (black diamonds), from CNSFR (green asterisks) studied by Díaz et al. (2007) and from central region (dark green triangle) of M33 studied by López-Hernández et al. (2013) are also included for comparison. Right: diagnostic diagram of the CALIFA outer region sample (blue circles). Different shades correspond to different bins of distance to the center of the galaxy, as indicated. Point from the IC 132 H ii region (orange square) of M33 studied by López-Hernández et al. (2013) is included for comparison. Overplotted as black lines in both diagrams are empirically and theoretically derived separations between LINERs/Seyferts and H ii regions.
Current usage metrics show cumulative count of Article Views (full-text article views including HTML views, PDF and ePub downloads, according to the available data) and Abstracts Views on Vision4Press platform.
Data correspond to usage on the plateform after 2015. The current usage metrics is available 48-96 hours after online publication and is updated daily on week days.
Initial download of the metrics may take a while.