Fig. 11
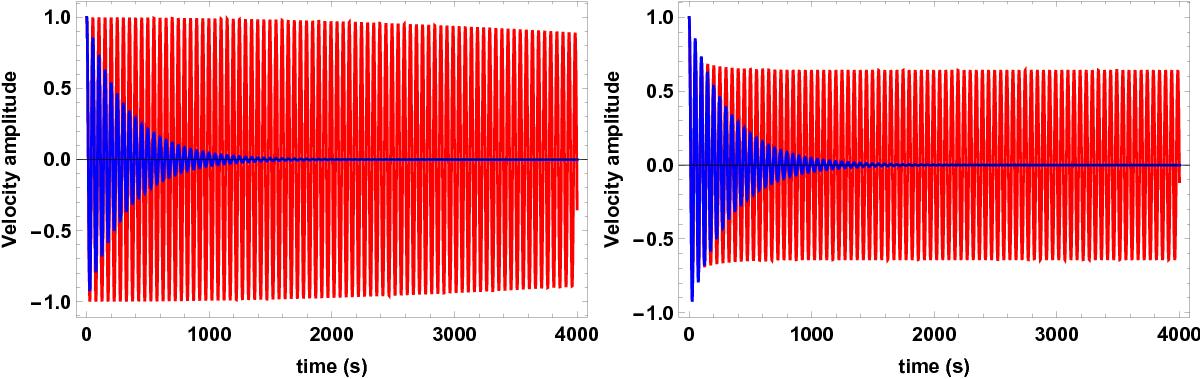
Alfvén wave velocity amplitude vs. time. Left panel: plasma cooled from T0(t) = 9000 K to 4000 K (red line); partially ionized plasma with T0 = 5000 K and ξi = 0.02 (blue line). Right panel: plasma heated from T0(t) = 4000 K to 9000 K (red line); partially ionized plasma with T0 = 5000 K and ξi = 0.02 (blue line; kx = 10-6 m-1). The velocity amplitude has been normalized.
Current usage metrics show cumulative count of Article Views (full-text article views including HTML views, PDF and ePub downloads, according to the available data) and Abstracts Views on Vision4Press platform.
Data correspond to usage on the plateform after 2015. The current usage metrics is available 48-96 hours after online publication and is updated daily on week days.
Initial download of the metrics may take a while.