Fig. 1
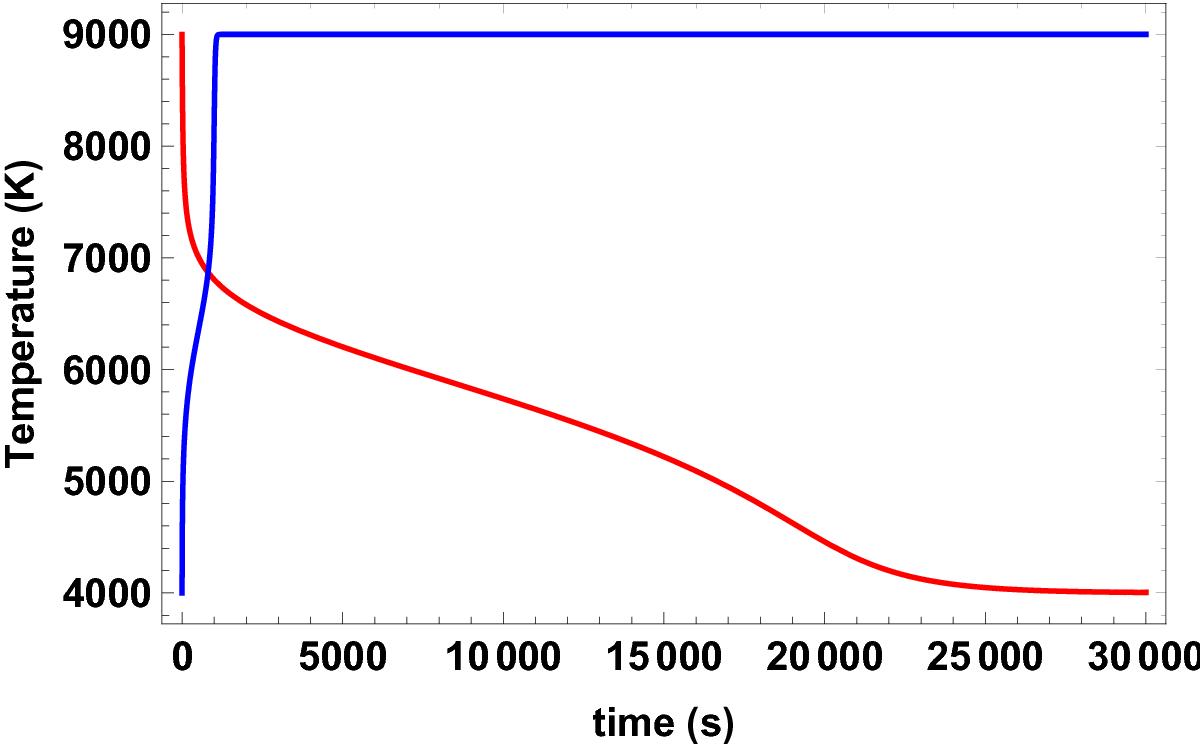
Temperature vs. time for the cooling (red line) and heating (blue line) processes. In all the plots, the initial temperature for the heating process is 4000 K and the final temperature is 9000 K, while in the cooling process, the initial and final temperatures are 9000 K and 4000 K, respectively. Furthermore, from now on, in all the plots optically thin radiation has been considered as well as the same constant density value, ρ = 5 × 10-11 kg m-3.
Current usage metrics show cumulative count of Article Views (full-text article views including HTML views, PDF and ePub downloads, according to the available data) and Abstracts Views on Vision4Press platform.
Data correspond to usage on the plateform after 2015. The current usage metrics is available 48-96 hours after online publication and is updated daily on week days.
Initial download of the metrics may take a while.