Fig. 9
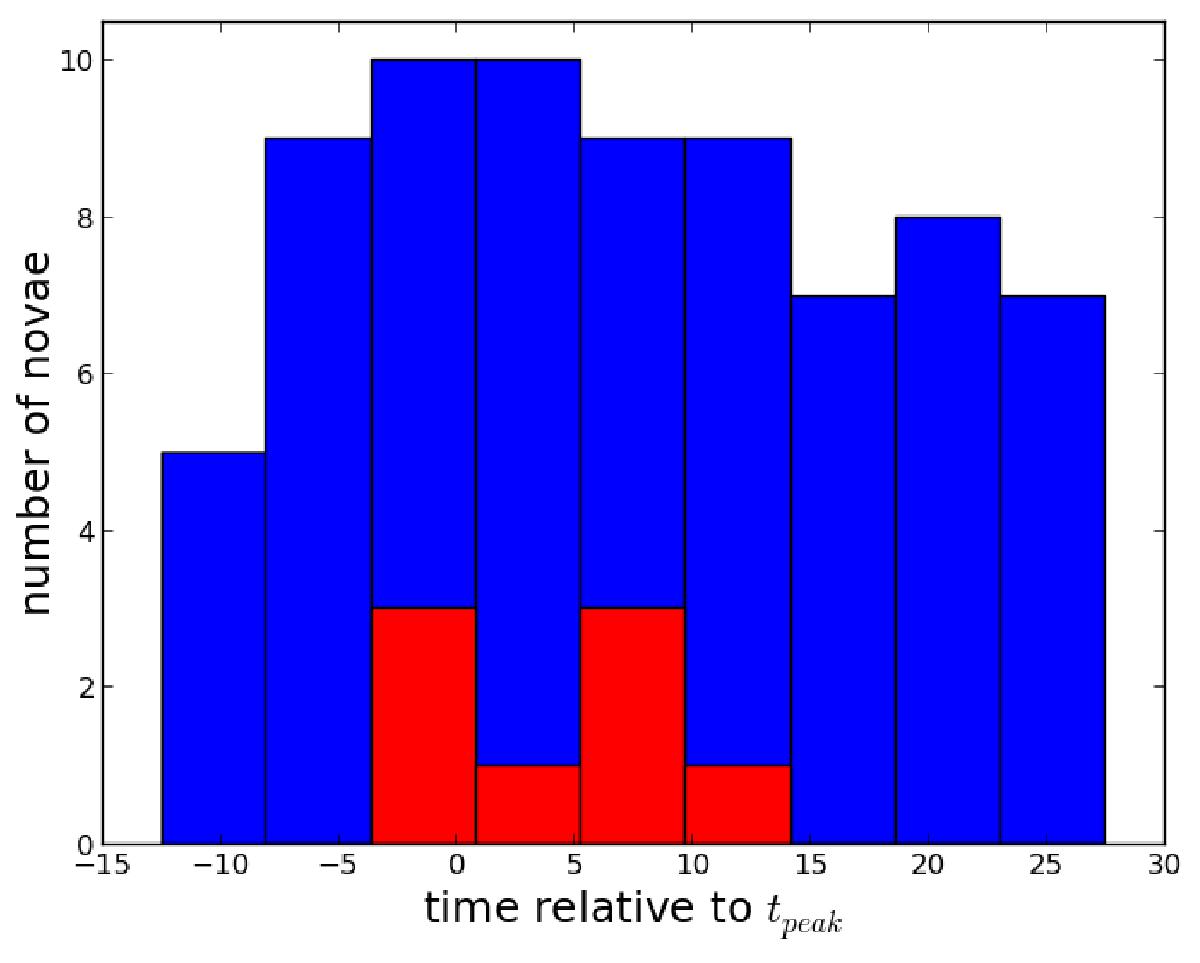
Histogram of the time difference between the central time of the time window with maximum TS and the optical peak time (including all novae in our sample). The time difference can vary from − 12.5 to 27.5 days relative to the peak. Novae with a maximum TS smaller than 14.5 are shown in blue, sources with larger TS are plotted in red.
Current usage metrics show cumulative count of Article Views (full-text article views including HTML views, PDF and ePub downloads, according to the available data) and Abstracts Views on Vision4Press platform.
Data correspond to usage on the plateform after 2015. The current usage metrics is available 48-96 hours after online publication and is updated daily on week days.
Initial download of the metrics may take a while.