Fig. 3
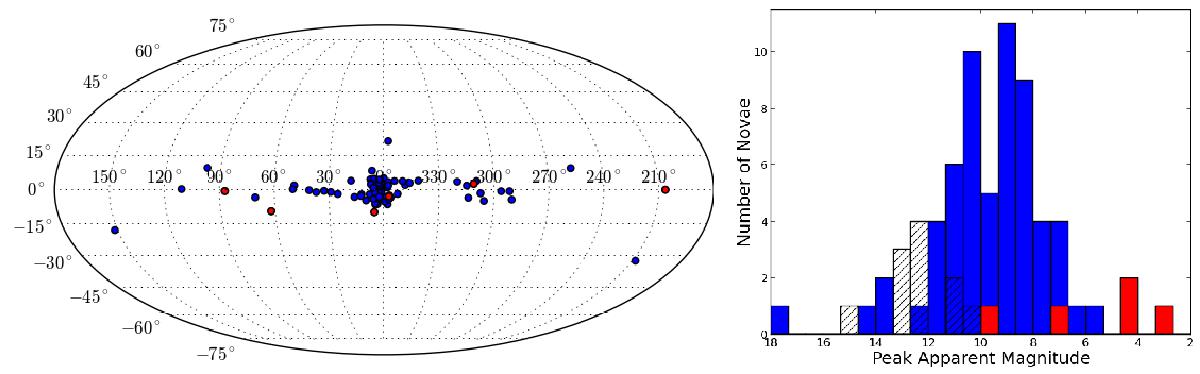
Novae selected in a time range from August 2008 to the end of 2015. Left: spatial distribution in Galactic coordinates of the novae listed in Table A.1. Previously detected gamma-ray novae are shown in red. Right: optical peak apparent magnitude distribution of the novae, magnitudes of the five out of the six previously detected gamma-ray novae are overlaid in red. The peak magnitude of V959 Mon is not included because it has not been measured since the nova was too close to the Sun to be observed during its outburst. Most magnitudes are in V band. Peak magnitudes of novae that were only observed in I band are displayed by striped bars.
Current usage metrics show cumulative count of Article Views (full-text article views including HTML views, PDF and ePub downloads, according to the available data) and Abstracts Views on Vision4Press platform.
Data correspond to usage on the plateform after 2015. The current usage metrics is available 48-96 hours after online publication and is updated daily on week days.
Initial download of the metrics may take a while.