Fig. 16
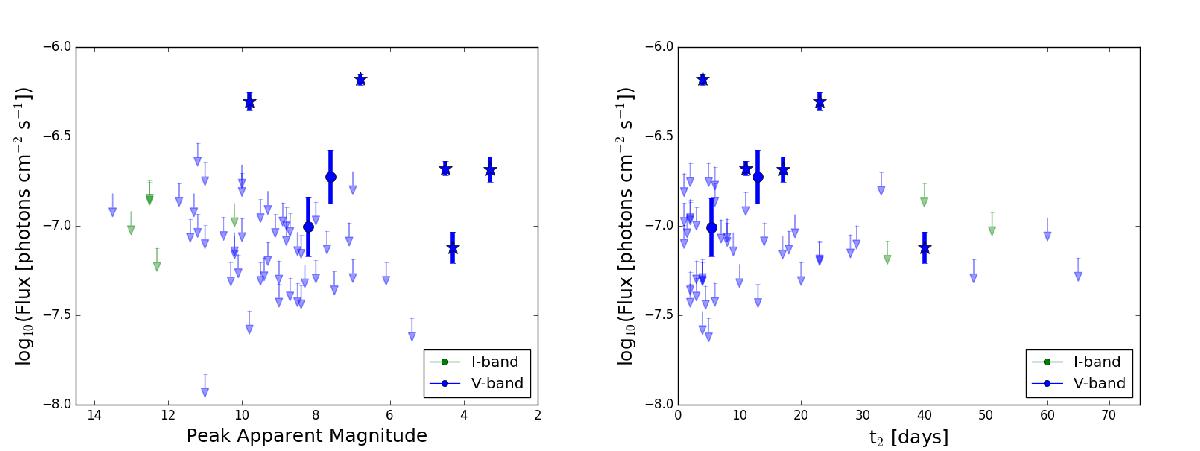
Correlation of the gamma-ray flux with the optical peak apparent magnitude (left) and t2 (right): sources with TS> 14.5 (corresponding to 3σ) are shown as blue circles, while known gamma-ray novae are indicated as stars. Note that V959 Mon is not included because the peak was not covered by optical observations. Less significant sources are shown as upper limits indicated by arrows. The peak magnitude is measured in V band for most cases (shown in blue), but for a few cases, only I-band data were available (shown in green).
Current usage metrics show cumulative count of Article Views (full-text article views including HTML views, PDF and ePub downloads, according to the available data) and Abstracts Views on Vision4Press platform.
Data correspond to usage on the plateform after 2015. The current usage metrics is available 48-96 hours after online publication and is updated daily on week days.
Initial download of the metrics may take a while.