Free Access
Fig. 11
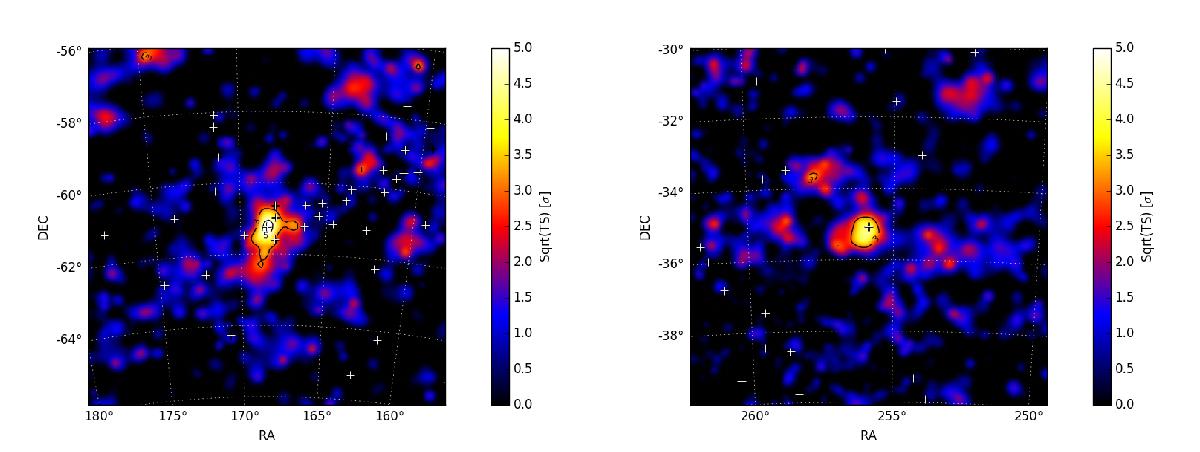
TS map in the time window with maximum TS for V679 Car (left) and V1535 Sco (right). The white crosses indicate the point sources used in the model, i.e. the 3FGL background sources and the nova in the center. The black lines indicate the 3σ and 5σ contours.
Current usage metrics show cumulative count of Article Views (full-text article views including HTML views, PDF and ePub downloads, according to the available data) and Abstracts Views on Vision4Press platform.
Data correspond to usage on the plateform after 2015. The current usage metrics is available 48-96 hours after online publication and is updated daily on week days.
Initial download of the metrics may take a while.