Free Access
Fig. 10
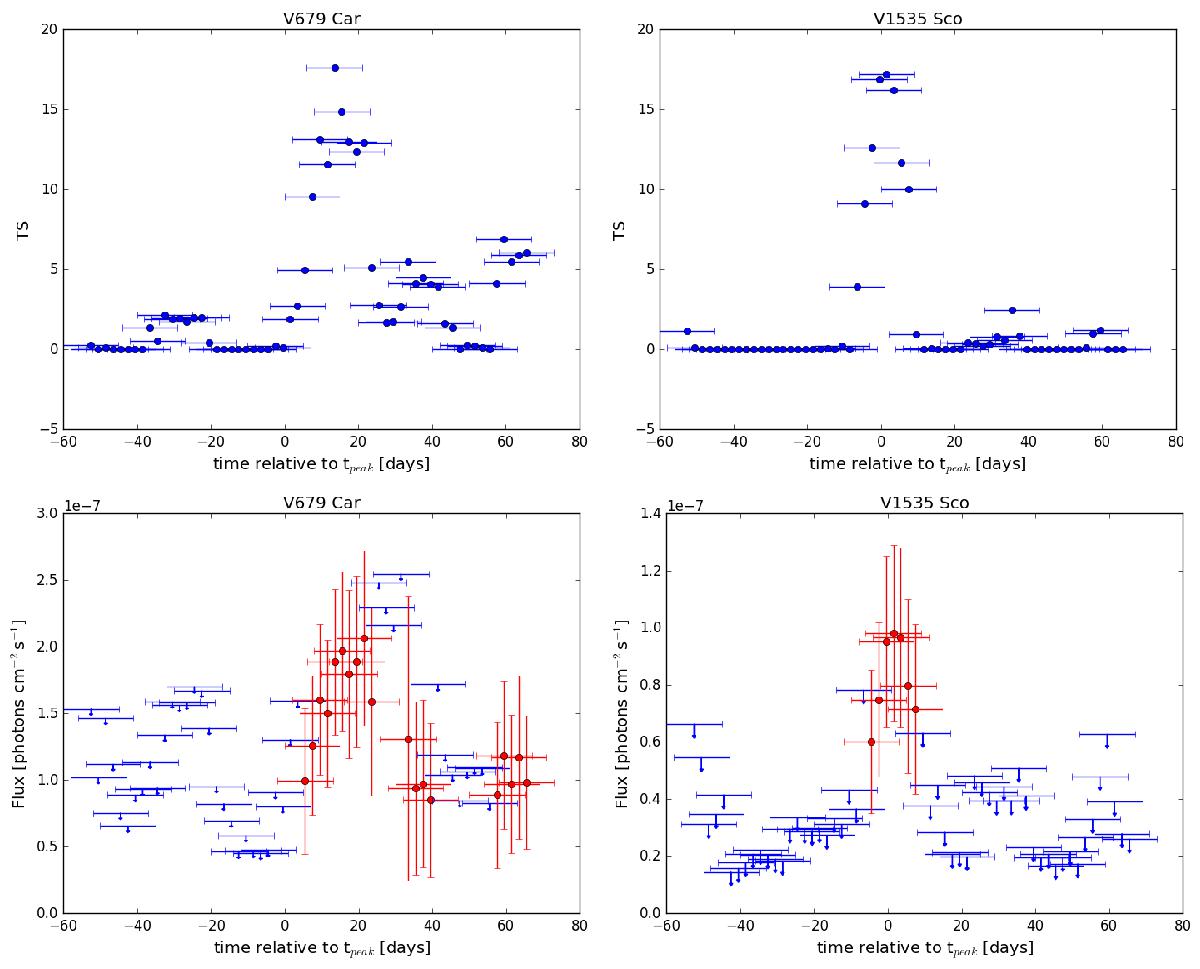
Sliding time window results for V679 Car (left) and V1535 Sco (right). The upper row shows the TS value for each tested time window, while the lower row shows the measured flux above 100 MeV (TS> 4, red) or 95% flux upper limits (blue).
Current usage metrics show cumulative count of Article Views (full-text article views including HTML views, PDF and ePub downloads, according to the available data) and Abstracts Views on Vision4Press platform.
Data correspond to usage on the plateform after 2015. The current usage metrics is available 48-96 hours after online publication and is updated daily on week days.
Initial download of the metrics may take a while.