Fig. 6
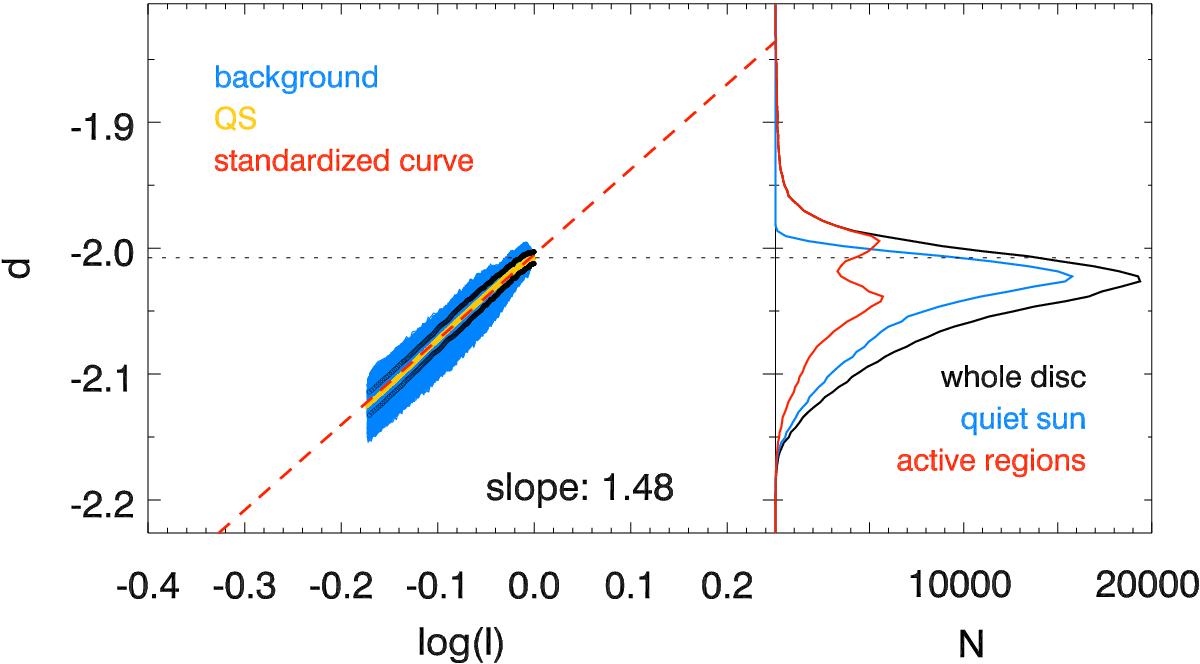
Left: CC derived from the processing of the Ko observation shown in Fig. 3 (red), measured CC for the QS (orange) with 1σ uncertainty (black) and the whole background (blue). The slope of the derived CC is also shown. Right: distribution of density values for the QS (blue), AR (red) and whole disc (black). The horizontal dashed line in both panels denotes the highest value of the QS CLV.
Current usage metrics show cumulative count of Article Views (full-text article views including HTML views, PDF and ePub downloads, according to the available data) and Abstracts Views on Vision4Press platform.
Data correspond to usage on the plateform after 2015. The current usage metrics is available 48-96 hours after online publication and is updated daily on week days.
Initial download of the metrics may take a while.