Fig. A.15
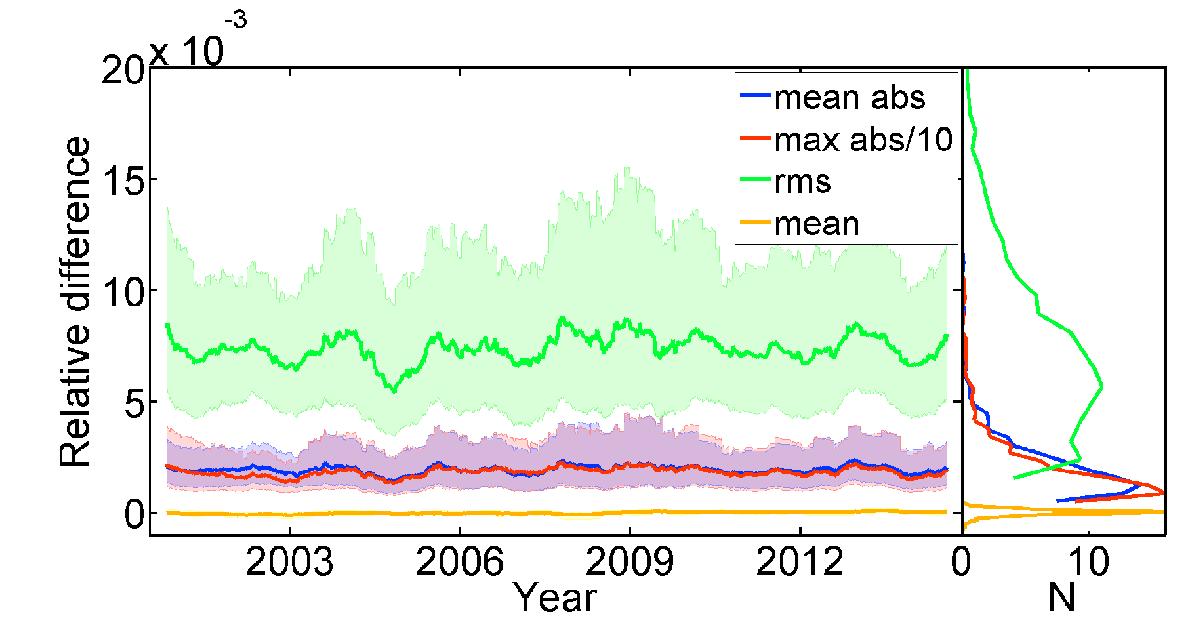
Left: relative difference between the NSB and the imposed background (within 0.98 R) for all the synthetic data of subset 8. RMS difference (green), mean absolute difference (blue), mean difference (orange) and maximum difference (red). These differences are plotted vs. the date on which the original Rome/PSPT images (that were randomly distorted) were recorded. Note that the maximum difference values have been divided by ten to plot them on the same scale as the other quantities. The solid lines are 100 point averages and the shaded surfaces denote the asymmetric 1σ interval. Right: distribution of the relative difference values.
Current usage metrics show cumulative count of Article Views (full-text article views including HTML views, PDF and ePub downloads, according to the available data) and Abstracts Views on Vision4Press platform.
Data correspond to usage on the plateform after 2015. The current usage metrics is available 48-96 hours after online publication and is updated daily on week days.
Initial download of the metrics may take a while.