Free Access
Fig. A.13
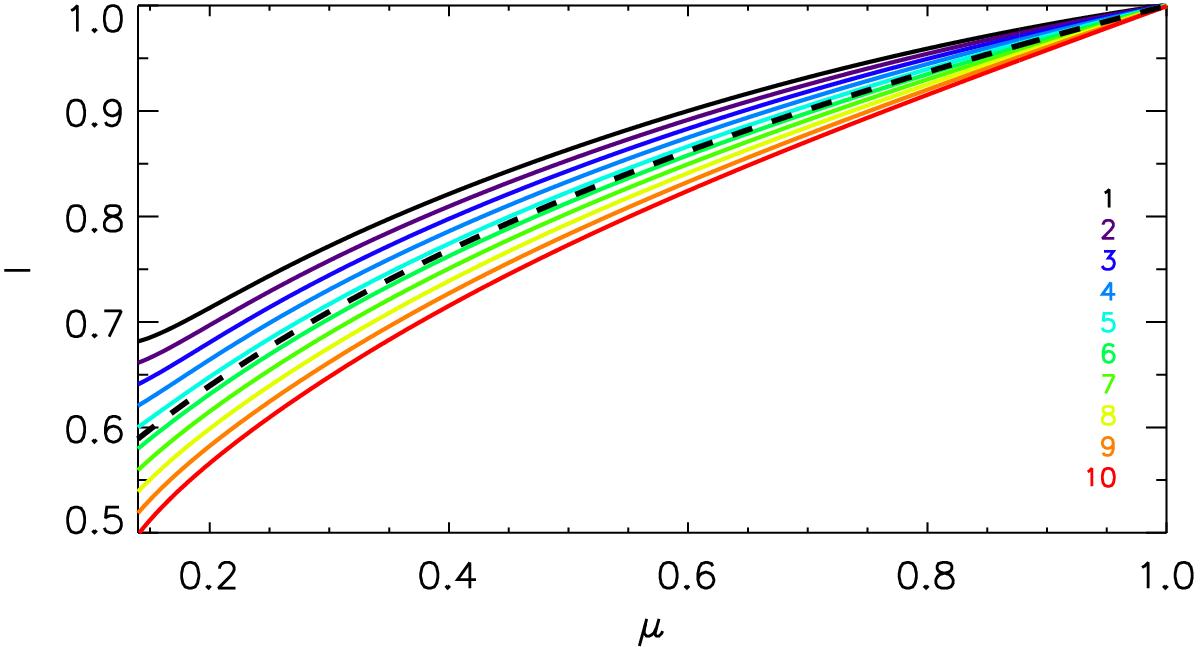
Intensity CLV imposed on the images of subset 7. The dashed black line denotes the average CLV measured on Rome/PSPT observations. The colours from black to red correspond to the cases 1–10 shown in Fig. A.14.
Current usage metrics show cumulative count of Article Views (full-text article views including HTML views, PDF and ePub downloads, according to the available data) and Abstracts Views on Vision4Press platform.
Data correspond to usage on the plateform after 2015. The current usage metrics is available 48-96 hours after online publication and is updated daily on week days.
Initial download of the metrics may take a while.