Fig. A.10
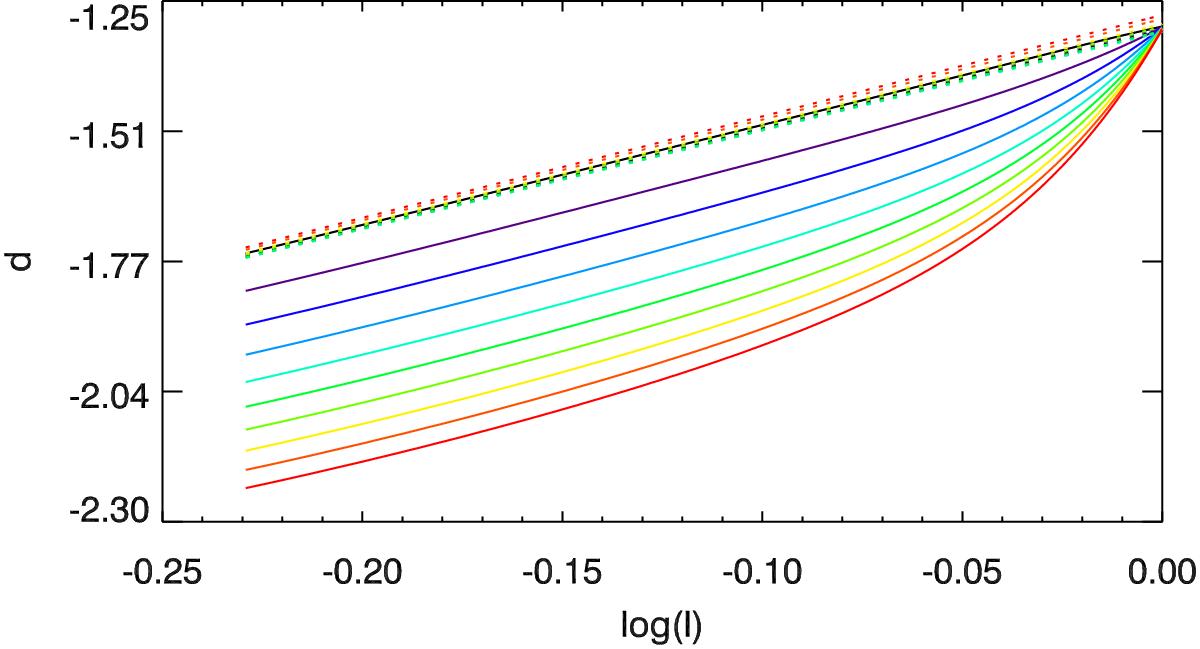
CC for synthetic images with vignetting (subset 5) created from Rome/PSPT observation taken on 21/08/2000. The colours denote the magnitude of the vignetting, with red for the strongest case and black for no vignetting. The solid curves are derived with the values measured on the density image, while the dotted curves are after the correction for the vignetting by our method.
Current usage metrics show cumulative count of Article Views (full-text article views including HTML views, PDF and ePub downloads, according to the available data) and Abstracts Views on Vision4Press platform.
Data correspond to usage on the plateform after 2015. The current usage metrics is available 48-96 hours after online publication and is updated daily on week days.
Initial download of the metrics may take a while.