Fig. A.8
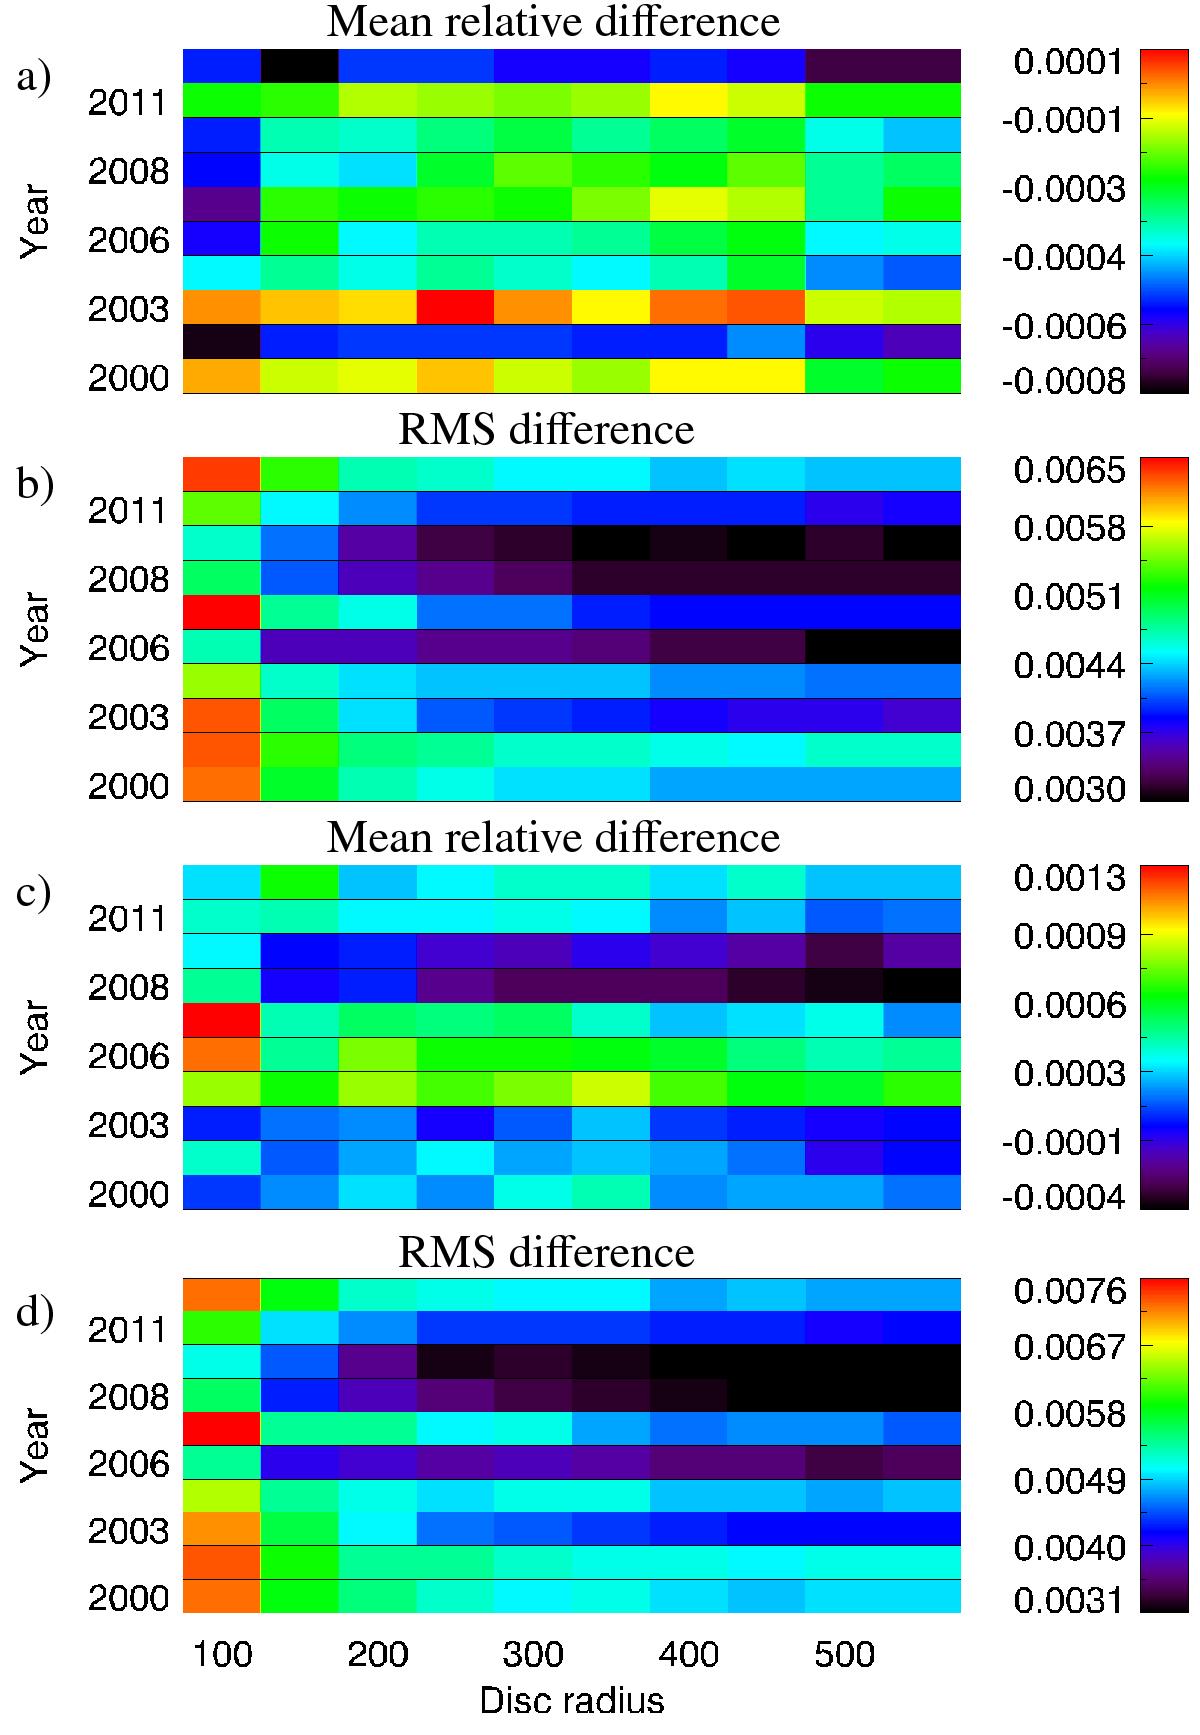
Colour-coded relative differences between the images retrieved by applying our method to images of subset 4 and the underlying original, undegraded Rome/PSPT images. Each box (with a given colour) corresponds to a different synthetic image; row (column) shows results derived from a given Rome/PSPT observation (imposed radius). Note the different scale of the colour code, as represented by the corresponding colour bars. a) Mean relative and b) rms difference between the NSB and the imposed background within a given subfigure, c) mean relative and d) rms difference between the retrieved contrast image and the original data. The values are given for disc positions within 0.98 R.
Current usage metrics show cumulative count of Article Views (full-text article views including HTML views, PDF and ePub downloads, according to the available data) and Abstracts Views on Vision4Press platform.
Data correspond to usage on the plateform after 2015. The current usage metrics is available 48-96 hours after online publication and is updated daily on week days.
Initial download of the metrics may take a while.