Fig. A.7
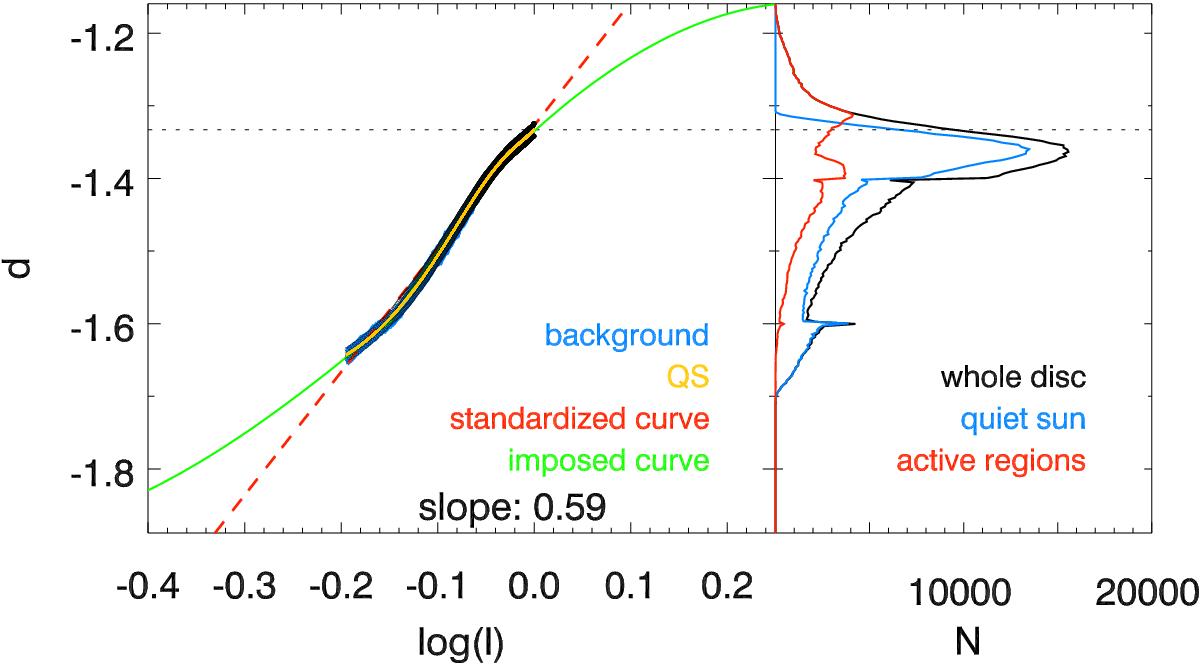
Left: imposed CC (green), standardized CC derived with our method (red), CC estimated from the QS (orange) with its 1σ level (black circles), and the whole background (blue, lying almost perfectly behind the black circles) of the synthetic image of subset 3 derived from Rome/PSPT observation taken on 21/08/2000 (shown in Fig. 7 S3/1)), which corresponds to an extreme case of over- and under-exposure on the QS considered in our study (level 10 for both under- and over- exposure). Shown also is the slope of the derived CC. Right: distribution of density values for the QS (blue), the AR (red) and the whole disc (black). The dashed line in both panels denotes the highest value of the QS CLV.
Current usage metrics show cumulative count of Article Views (full-text article views including HTML views, PDF and ePub downloads, according to the available data) and Abstracts Views on Vision4Press platform.
Data correspond to usage on the plateform after 2015. The current usage metrics is available 48-96 hours after online publication and is updated daily on week days.
Initial download of the metrics may take a while.