Fig. A.6
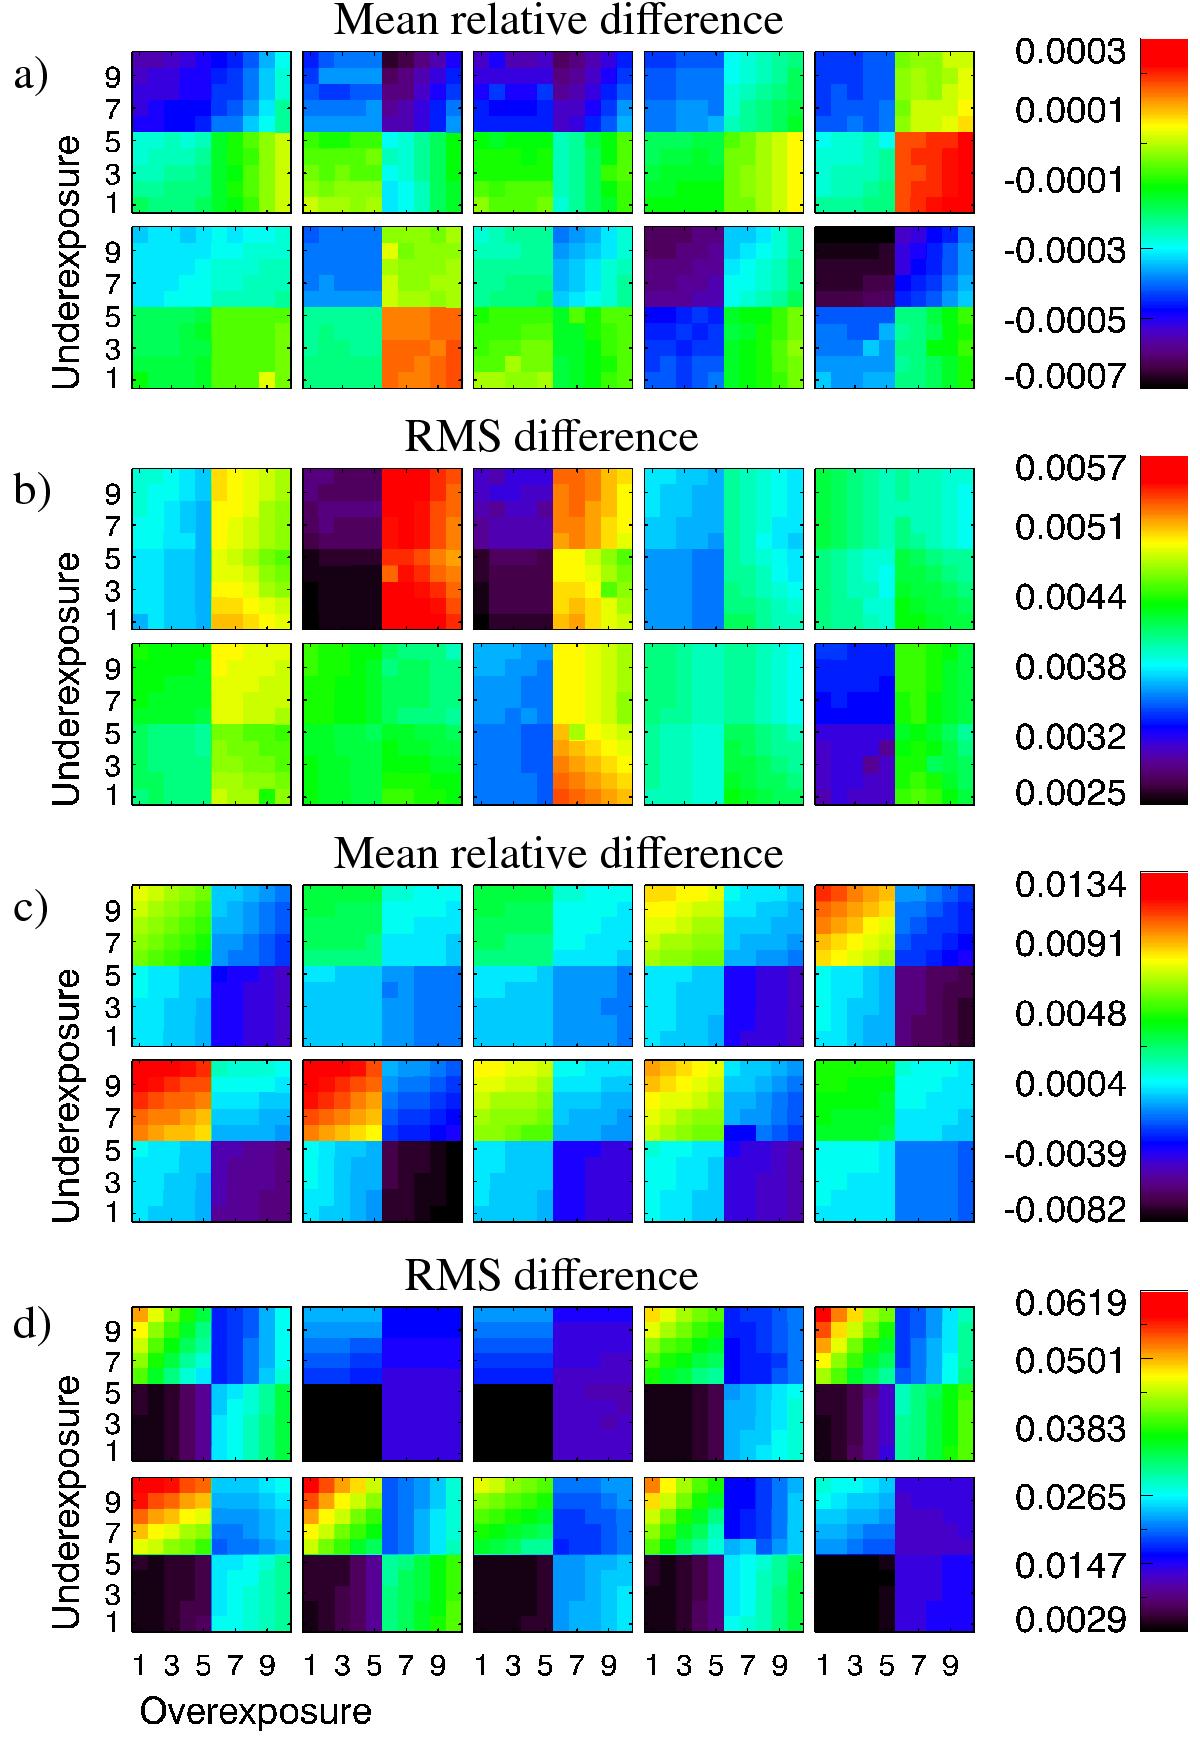
Colour-coded errors from application of our method to images of subset 3. The colour of each box (so-to-say each pixel of the plotted pattern) represents the error introduced when processing one particular Rome/PSPT image with different introduced exposure problems. Each square composed of 10 × 10 boxes in a given panel corresponds to synthetic images created from a given Rome/PSPT image, with the rows (columns) within the square showing the errors for different combinations of under- (over-) exposures considered (the employed CC curves are shown in Fig. A.5). The colour bar applies to all boxes in a given panel. a) Mean relative and b) rms difference between the NSB and the imposed background for all images, c) mean relative and d) rms difference between the retrieved contrast image and the original data. The values are given for disc positions within 0.98 R.
Current usage metrics show cumulative count of Article Views (full-text article views including HTML views, PDF and ePub downloads, according to the available data) and Abstracts Views on Vision4Press platform.
Data correspond to usage on the plateform after 2015. The current usage metrics is available 48-96 hours after online publication and is updated daily on week days.
Initial download of the metrics may take a while.